It is just one of a number of maps of the distribution of world wealth provided by Worldmapper. Thus the section of the website on wealth includes maps of:
* Research and Development ExpenditureThere is also a section of maps on education. A section of maps on communication is under development, due later in 2006.
* Research and Development Employees
* Patents Granted
* Royalty Fees
The section titled "manufacturers" includes maps of:
* Electronics ExportsWorldmapper is a product of the Social and Spatial Inequalities Research Group of the Geography department of the University of Sheffield.
* Electronics Imports
* Computers Exports
* Computers Imports
Examples
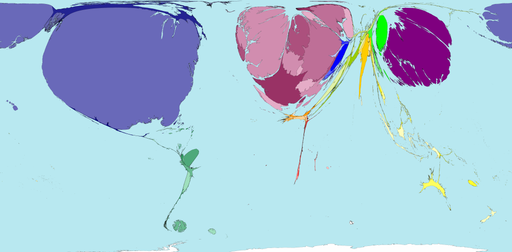
Here are two of their great maps, illustrating the degree to which a few rich countries dominate the control of patent rights. Of course, they do so by reason of their heavy expenditures on research and development, which are justified by the income generated by their industrial innovation. If knowledge is the new generator of competitive advantage, these countries have a comparative advantage in knowledge generation.

Territory size shows the proportion all patents worldwide that were granted there.
© Copyright 2006 SASI Group (University of Sheffield) and Mark Newman (University of Michigan)
Territory size shows the proportion of worldwide earnings (in purchasing power parity) from royalties and license fees that are earned there.
© Copyright 2006 SASI Group (University of Sheffield) and Mark Newman (University of Michigan)

No comments:
Post a Comment