Bonds when issued promise a steady stream of returns for a period of years at the end of which the principle is returned to the owner. The value of the bond is determined by the present value of those payments -- that is, summing all future payments, each discounted according to expected inflation. The higher the inflation rate, the higher the interest rate must be on the bond to get people to buy.
Unfortunately, not all bond sellers are able to make the scheduled set of payments. The higher the risk of noncompliance, the lower the price that buyers are willing to pay (or to put it differently, the higher the interest rate on the bonds that the buyers demand).
Stock prices are similarly determined. The buyer of a company's stock (in theory) calculates the present value of the stream of dividends and of the price of the stock when sold.
The buyer also estimates the risk involved. The purchase price of the stock must be acceptable in terms of both the present value of future income from the stock and the risk involved.
Investors can choose between stocks and bonds, so each affects the price of the other. If interest rates are low (and thus the prices of bonds are high), the prices of stocks will also be high.
Taxes also count. People should be more interested in their after tax income and net worth than in the pre-tax values. If taxes on dividends, interest and long term profits are low, they the prices of stocks and bonds should be higher.
Of course there are bubbles and crashes when prices depart significantly from the rational values as described above. Buyers suffer from "irrational exuberance" during the expansion of a bubble and irrational pessimism during the latter parts of a crash,
Several weeks ago I posted including a graph of the historical relation between the total value of stocks on the U.S. stock market and the Gross Domestic Product (GDP). That ratio went very high in the e-commerce bubble in the late 1990s, again in the housing bubble of the mid 2000s, and is again high. Interpretation of the trends is complicated by the fact that many companies are multinational, drawing their profits from production and sales in other countries.
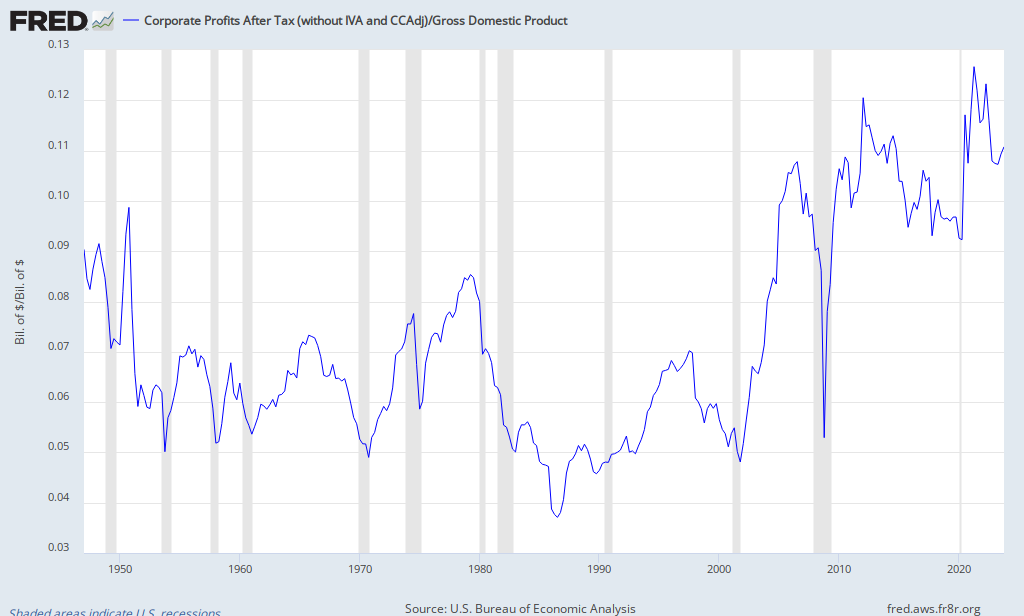
However, a portion of the GDP of the country goes into corporate profits and thus into corporate dividends and the increase in capital of the corporations -- the bigger the GDP the greater might be the corporate profits and thus the greater the total value of corporate stocks.
 |
| Source |
Corporate Profits After Tax (CP)/Gross Domestic Product
 |
| Source |
 |
| Source |
I found one published explanation from last year:

No comments:
Post a Comment