Participants from the 2012 session of Innovation for Economic Development at Harvard Kennedy School discuss their Executive Education experience.
Thursday, May 30, 2013
Innovation for Economic Development
Participants from the 2012 session of Innovation for Economic Development at Harvard Kennedy School discuss their Executive Education experience.
Charles Leadbeater: The era of open innovation
In this deceptively casual talk, Charles Leadbeater weaves a tight argument that innovation isn't just for professionals anymore. Passionate amateurs, using new tools, are creating products and paradigms that companies can't.This is an interesting talk, still valid after eight years. I just want to focus on the first part -- the invention of the mountain bike.
 |
| You had to be fearless and athletic to ride this! |
We now have many conceptions of different bicycles (and indeed of cycles that have more wheels than two. There are racing bikes used in the great road races, low cost bikes for adult transportation in developing countries in Asia, and bikes with training wheels for little kids. The mountain bikes considered by Leadbeater are just construed for different purposes, and thus built on a different design specific to those purposes. It is perhaps not surprising that the design of the the mountain bike arose from people who were inventing a new sport of off road bicycling, rather than from a corporation seeking to create a new market niche.
It may be worth pointing out that the technological system of the bicycle has benefited from many innovators, some of whom are very high tech indeed. Think of the advanced materials that go into the bikes used in the Tour de France which combine great strength with very little weight, resulting in bikes that cost thousands of dollars.
| Think about the science and technology behind the light emitting diodes and mini-generator that illuminate this bike! |
Steven Johnson: Where good ideas come from
People often credit their ideas to individual "Eureka!" moments. But Steven Johnson shows how history tells a different story. His fascinating tour takes us from the "liquid networks" of London's coffee houses to Charles Darwin's long, slow hunch to today's high-velocity web.
Wednesday, May 29, 2013
Don't read this!
So all the countries of the world have hackers who are plundering the technical materials in companies and ministries of war of all the other countries of the world.
I remember the long past days when I was a young engineer. We loved to do blue sky thinking. I bet young engineers still do love that.
Someone should encourage young engineers to blue sky ideas that won't work but that look like.they would work.
I also would bet that all the engineers who have been around for a while have things in their files that they thought were beautiful ideas, but that were killed by ugly facts. Their ideas just didn't work in fact.
Someone ought to put all those beautiful, unworkable ideas in corporate and government data bases, protected by their best firewalls. Then, when they were hacked, the folk who stole them would go crazy trying to make the unworkable ideas work.
Tuesday, May 28, 2013

Sunday, May 26, 2013
Quotation
"[Barack Obama] is a thoughtful and a resolute leader who understands that America is strongest when her economic power, her diplomatic power, and her military power align with the power of our principles -- the beliefs we share in freedom, in justice, and in the dignity of every human being."
Governor Martin O'Malley
The Economist's Schumpeter column provides an interesting piece on social impacts of emerging technology
I quote from The Economist:
Two things are clear. The first is that smart machines are evolving at breakneck speed. Moore’s law—that the computing power available for a given price doubles about every 18 months—continues to apply. This power is leaping from desktops into people’s pockets. More than 1.1 billion people own smartphones and tablets. Manufacturers are putting smart sensors into all sorts of products. The second is that intelligent machines have reached a new social frontier: knowledge workers are now in the eye of the storm, much as stocking-weavers were in the days of Ned Ludd, the original Luddite. Bank clerks and travel agents have already been consigned to the dustbin by the thousand; teachers, researchers and writers are next. The question is whether the creation will be worth the destruction.The article is based on two sources:
- Race Against the Machine: How the Digital Revolution is Accelerating Innovation, Driving Productivity, and Irreversibly Transforming Employment and the Economy by Erik Brynjolfsson and Andrew McAfee
- "Disruptive technologies: Advances that will transform life, business and the global economy"

A thought for you younger people.
So there is high unemployment. And we are going to reform Social Security by increasing retirement age. Doesn't that mean that we are going to keep unemployment for young people higher? We know that when young people delay their first job (unless they are investing in education), their earnings are decreased for the rest of their lives. Yet our schools are not equipped to train young people to work successfully in the knowledge economy. The baby boom babies are reaching retirement age. The revolution in birth control methods dropped birth rate, and thus the rate of new entrants into the labor market following the baby boom. Immigration is down, and there is a strong movement to reduce immigration of workers who may compete with our unemployed workers and youths. Guess what this means for the long term ability of the working population to support our increasingly long lived population of old people and their increasingly expensive medical needs.
“Correlation versus causation in a single graph”So
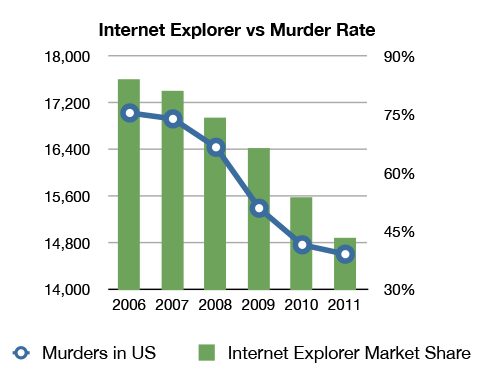 |
| Source: Chris Blattman |
SENIOR DISCOUNTS
This came from a source I don't know, and so I can't guarantee that all the discounts are right. I have used some of them. Besides, asking for a senior discount costs you nothing.
Here is the list with the amount of discount and the age required to qualify for the discount.
RESTAURANTS:
- Applebee's: 15% off with Golden Apple Card (60+)
- Arby's: 10% off ( 55 +)
- Ben & Jerry's: 10% off (60+)
- Bennigan's: discount varies by location (60+)
- Bob's Big Boy: discount varies by location (60+)
- Boston Market: 10% off (65+)
- Burger King: 10% off (60+)
- Chick-Fil-A: 10% off or free small drink or coffee ( 55+)
- Chili's: 10% off ( 55+)
- CiCi's Pizza: 10% off (60+)
- Denny's: 10% off, 20% off for AARP members ( 55 +)
- Dunkin' Donuts: 10% off or free coffee ( 55+)
- Einstein's Bagels: 10% off baker's dozen of bagels (60+)
- Fuddrucker's: 10% off any senior platter ( 55+)
- Gatti's Pizza: 10% off (60+)
- Golden Corral: 10% off (60+)
- Hardee's: $0.33 beverages everyday (65+)
- IHOP: 10% off ( 55+)
- Jack in the Box: up to 20% off ( 55+)
- KFC: free small drink with any meal ( 55+)
- Krispy Kreme: 10% off ( 50+)
- Long John Silver's: various discounts at locations ( 55+)
- McDonald's: discounts on coffee everyday ( 55+)
- Mrs. Fields: 10% off at participating locations (60+)
- Shoney's: 10% off
- Sonic: 10% off or free beverage (60+)
- Steak 'n Shake: 10% off every Monday & Tuesday ( 50+)
- Subway: 10% off (60+)
- Sweet Tomatoes: 10% off (62+)
- Taco Bell : 5% off; free beverages for seniors (65+)
- TCBY: 10% off ( 55+)
- Tea Room Cafe: 10% off ( 50+)
- Village Inn: 10% off (60+)
- Waffle House: 10% off every Monday (60+)
- Wendy's: 10% off ( 55 +)
- Whataburger: 10% off (62+)
- White Castle: 10% off (62+)
RETAIL & APPAREL :
- Banana Republic: 30% off ( 50 +)
- Bealls: 20% off first Tuesday of each month ( 50 +)
- Belk's: 15% off first Tuesday of every month ( 55 +)
- Big Lots: 30% off
- Bon-Ton Department Stores: 15% off on senior discount days ( 55 +)
- C.J. Banks: 10% off every Wednesday (50+)
- Clarks : 10% off (62+)
- Dress Barn: 20% off ( 55+)
- Goodwill: 10% off one day a week (date varies by location)
- Hallmark: 10% off one day a week (date varies by location)
- Kmart: 40% off (Wednesdays only) ( 50+)
- Kohl's: 15% off (60+)Modell's Sporting Goods: 30% off
- Rite Aid: 10% off on Tuesdays & 10% off prescriptions
- Ross Stores: 10% off every Tuesday ( 55+)
- The Salvation Army Thrift Stores: up to 50% off ( 55+)
- Stein Mart: 20% off red dot/clearance items first Monday of every month ( 55 +)
GROCERY :
- Albertson's: 10% off first Wednesday of each month ( 55 +)
- American Discount Stores: 10% off every Monday ( 50 +)
- Compare Foods Supermarket: 10% off every Wednesday (60+)
- DeCicco Family Markets: 5% off every Wednesday (60+)
- Food Lion: 60% off every Monday (60+)
- Fry's Supermarket: free Fry's VIP Club Membership & 10% off every Monday ( 55 +)
- Great Valu Food Store: 5% off every Tuesday (60+)
- Gristedes Supermarket: 10% off every Tuesday (60+)
- Harris Teeter: 5% off every Tuesday (60+)
- Hy-Vee: 5% off one day a week (date varies by location)
- Kroger: 10% off (date varies by location)
- Morton Williams Supermarket: 5% off every Tuesday (60+)
- The Plant Shed: 10% off every Tuesday ( 50 +)
- Publix: 15% off every Wednesday ( 55 +)
- Rogers Marketplace: 5% off every Thursday (60+)
- Uncle Guiseppe's Marketplace: 15% off (62+)
TRAVEL :
Airlines:
- Alaska Airlines: 50% off (65+)
- American Airlines: various discounts for 50% off non-peak periods (Tuesdays - Thursdays) (62+)and up (call before booking for discount)
- Continental Airlines: no initiation fee for Continental Presidents Club & special fares for select destinations
- Southwest Airlines: various discounts for ages 65 and up (call before booking for discount)
- United Airlines: various discounts for ages 65 and up (call before booking for discount)
- U.S. Airways: various discounts for ages 65 and up (call before booking for discount)
Rail:
- Amtrak: 15% off (62+)
Bus:
- Greyhound: 15% off (62+)
- Trailways Transportation System: various discounts for ages 50+
CAR RENTAL:
- Alamo Car Rental: up to 25% off for AARP members
- Avis: up to 25% off for AARP members
- Budget Rental Cars: 40% off; up to 50% off for AARP members ( 50+)
- Dollar Rent-A-Car: 10% off ( 50+) Enterprise Rent-A-Car: 5% off for AARP members Hertz: up to 25% off for AARP members
- National Rent-A-Car: up to 30% off for AARP members
OVERNIGHT ACCOMODATIONS:
- Holiday Inn: 20-40% off depending on location (62+)
- Best Western: 40% off (55+)
- Cambria Suites: 20%-30% off (60+)
- Waldorf Astoria - NYC $5,000 off nightly rate for Presidential Suite (55 +)
- Clarion Motels: 20%-30% off (60+)
- Comfort Inn: 20%-30% off (60+)
- Comfort Suites: 20%-30% off (60+)
- Econo Lodge: 40% off (60+)
- Hampton Inns & Suites: 40% off when booked 72 hours in advance
- Hyatt Hotels: 25%-50% off (62+)
- InterContinental Hotels Group: various discounts at all hotels (65+)
- Mainstay Suites: 10% off with Mature Traveler's Discount (50+); 20%-30% off (60+)
- Marriott Hotels: 25% off (62+)
- Motel 6: Stay Free Sunday nights (60+)
- Myrtle Beach Resort: 30% off ( 55 +)
- Quality Inn: 40%-50% off (60+)
- Rodeway Inn: 20%-30% off (60+)
- Sleep Inn: 40% off (60+)
ACTIVITIES & ENTERTAINMENT;
- AMC Theaters: up to 30% off ( 55 +)
- Bally Total Fitness: $100 off memberships (62+)
- Busch Gardens Tampa, FL: $13 off one-day tickets ( 50 +)
- Carmike Cinemas: 35% off (65+)
- Cinemark/Century Theaters: up to 35% off
- Massage Envy - NYC 20% off all "Happy Endings" (62 +)
- U.S. National Parks: $10 lifetime pass; 50% off additional services including camping (62+)
- Regal Cinemas: 50% off Ripley's Believe it or Not: @ off one-day ticket ( 55 +)
- SeaWorld, Orlando , FL : $3 off one-day tickets ( 50 +)
CELL PHONE DISCOUNTS :
- AT&T: Special Senior Nation 200 Plan $19.99/month (65+)
- Jitterbug: $10/month cell phone service ( 50 +)
- Verizon Wireless: Verizon Nationwide 65 Plus Plan $29.99/month (65+).
MISCELLANEOUS:
- Great Clips: $8 off hair cuts (60+)
- Supercuts: $8 off haircuts (60+)
A thought on the Memorial Day weekend.
 |
| Entrance to the Karnak Temple with obelisk and statue of the pharaoh |
 |
| Washington Monument and Lincoln Memorial |
 |
| Lincoln statue in the Lincoln memorial, Washington DC |
George Washington was not only the president who first lead the American democracy, but he deliberately did all that he could to show he was an elected citizen, not a king by divine right. He set aprecedents by retiring to his home after leading the successful revolutionary army and again after serving two terms as president of the new nation. How strange that his monument is an obelisk, copied from the Egyptian originals, especially since the Egyptian obelisks have been used so often in European countries to demonstrate the power of the kings and popes.
Abraham Lincoln who led the fight to assure that this country conceived in liberty and dedicated to the proposition that all men were created equal is represented in the Lincoln memorial in a statue very similar to that used to represent pharaohs in ancient Egypt. The pharaohs were god kings, ruling not by appointment by gods but deemed gods themselves. I suspect that the Egyptians who built these ancient monuments to their rulers were much like the slaves that Lincoln emancipated.
 |
| Statues of Ramses II at Abu Simbel |
Saturday, May 25, 2013
Geographic Distribution of High Scores on the SERI index.
Science and Engineering Readiness Index (SERI) State by State

The Science and Engineering Readiness Index (SERI) incorporates results from the National Assessment of Educational Progress (“NAEP”, conducted periodically by the U.S. Department of Education), Advanced Placement Examination results in calculus and physics, the physics course-taking results from the American Institute of Physics National Survey of High School Physics Teachers and information on teacher certification requirements in science compiled by the National Council on Teacher Quality (NCTQ). The information from these sources is gathered into three scores on mathematics performance, science performance and teacher qualifications. The scores are then used to assign each state a single composite score.
 |
| Source |
The Changing Economic Situation Calls for Changes in U.S. Foreign Policy

By 2025, the combined real output of six major emerging economies – Brazil, the Russian Federation, India, Indonesia, China and Korea – is expected to match that of the Euro Area, the largest economic area of the world today.
By 2025, economies such as Indonesia and Brazil will likely be as important economically as Japan and the United Kingdom.World Bank Managing Director Caroline Anstey
Friday, May 24, 2013
Thinking about Russia in the 1930s

It seems appropriate that a couple of decades after the breakup of the Soviet Union and the end of the Cold War we look at Stalinism with some historical perspective.
Obviously the Russians were struggling to invent new political institutions after the Russian Revolution and Civil War. The result was an authoritarian, coercive system which in the 1930s resulted in a cult of personality around Stalin.
The Russians were also struggling to invent new economic institutions having abolished private property and markets. The problems of production and distribution had to be solved.
As the book shows, a new social order was also developing with its own class structure. Aristocrats, priests, kulaks, and the bourgeoisie were eliminated. Communist functionaries, the proletariat, and intellectuals were given more prominence. Urbanization was rapid, and rural communities were seen as "backward". Secular forces successfully attacked Russia's traditional religious institutions.
Stalin and his government correctly perceived that after the 1930s the USSR would find itself at war with foreign enemies. To survive a modern war it was necessary to establish manufacturing industries, preferably deep within its territory. It was also necessary to establish military institutions that could fight a war, and that could be depended on not to mutiny and/or overthrow the government.
Change at this scale would necessarily take decades, even if the new alternatives were excellent. Clearly they were not.
I wonder how many readers of this book will understand the poverty of Russia in the 1930s. Here are some estimates: of per capita GDP (PPP in 1990 international prices):
- 1890, Russia, $944
- 1913, Russia, $1,551
- 1929, USSR, $1,426
- 1937, USSR, $2,267
Thus Russians had a per capita GDP of $4.25 per day in 1913, even less in 1929, and $6,21 in 1937. Average per capita household consumption is less. (In 2010, average per capita household consumption was 3/5th of per capita GDP worldwide.)
Thus Russia in 1913 had a per capita GDP comparable to Ghana in 2012; the USSR in 1929 had a per capita GDP comparable to that of Honduras in 2012. (Source)
 |
| Slum in Ghana |
| Honduran street scene |
The theory was that income distribution was even in Communist Russia but author Fitzpatrick points out that there were significant differences in income in the USSR in the 1930s. High officials of the government had dachas in the country as well as large apartments. They had chauffeur driven cars at their permanent disposition. They had free food distributions, higher salaries, and shopped at special stores with lower prices. On the other hand, those in rural areas had lower incomes and faced shortages of food and many goods. People out of favor of the party must also have been much poorer than average. Many people must have been quite poor! And when you are worse off than average and the average per capita household consumption is only a few dollars per day, you are really poor,
GDP per capita 1500-1950
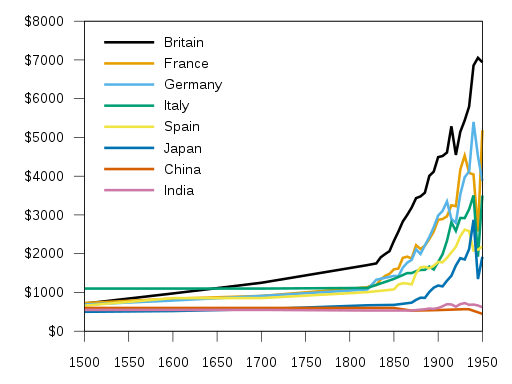 |
| Source: Wikimedia Commons |
As the graph above shows, the world was poor through much of history. In recent history, many but not all countries have seen rapid economic growth. However, different countries have seen the take off at different times. Russia was later than Britain, France, Germany and Italy but faster than many of the countries of Africa and Asia.
GDP per capita is only one indicator of development. It has been estimated that life expectancy in Russia was 39.3 years for men and 44.8 years for men in 1926; in 1938 it had only increased to 40.4 years for men and 46.7 years for women. The Soviet census of 1937 was destroyed because it indicated that the population of the Soviet Union had actually decreased since the 1926 census. The Soviet famine of 1932–1933 led to the deaths of millions.
GDP per capita is only one indicator of development. It has been estimated that life expectancy in Russia was 39.3 years for men and 44.8 years for men in 1926; in 1938 it had only increased to 40.4 years for men and 46.7 years for women. The Soviet census of 1937 was destroyed because it indicated that the population of the Soviet Union had actually decreased since the 1926 census. The Soviet famine of 1932–1933 led to the deaths of millions.
Interpreting the book
I suspect that many of the social conditions that are described in Fitzpatrick's book would be found in poor countries then and now. Some may be widely shared human behaviors described in Stalinist or Russian terms. Others are related to Russian history and the cultural heritage that people in Russia still shared from the country's Tsarist past. How much then is due to the Stalinist political and economic innovations?
Think about poor people who have real needs for food and shelter that are unmet and that they don't have the money needed to meet. They do what they can to assure the survival of their families and themselves. They live in crowded, poor quality housing. They do what they can to get food, sometimes depending on others, and sometimes even stealing. They dress poorly. They often don't send their children to school because they need the small increment of income that each child can bring into the household. Sometimes -- often -- they move to someplace else where they hope to be less poor, often migrating to the city. A lot of everyday Stalinism may simply have been everyday poverty.
Fitzpatrick describes the phenomenon of "blat", the use of personal connections to get access to things needed in the absence of a working market system and sufficiency of production. She describes "blat professionals" who worked to assure that factories got the input supplies needed to meet quotas, and "blat virtuosos" who helped consumers find consumer goods that they needed that were not available from the government nor government stores. I think we would call these people "fixers" and I think to some degree such people exist in most societies. I know that in my own work, a well stocked Rolodex used to be important. (Younger people might relate to lots of friends and contacts that they have through online social networking.)
She also describes a system of patronage in which lower ranked people depended on higher ranked patrons to solve problems for them. I worked a lot in Latin America and the partron is still an important part of one's social network for many Latins. So too is the compadre or comadre who help to get through the vicissitudes of life.
Of course, poverty was not the only bane of Russians in the 1930s. There were purges, large numbers of people in the gulags, crime, persecution of anyone connected to the former upper and middle classes, and lots of frank racial and religious prejudice. People spied on each other, and the fickle finger of the state could turn a difficult existence into a hellish one in an instant.

A thought about taxes
Mike Burns shared this interesting article with the following graph:

The 15 percent tax on long term capital gains has been the subject of a lot of attention. There is some justification. If you hold a stock for some years, inflation has taken place. Part of the profit from the sale is not really profit, but simply the increase in price necessary that you can buy as much now as you could have in the past before that inflation took place. Still it would be possible to make the tax on capital gains more equitable.
A problem is that rich people get richer by the appreciation of things that they own but never sell. They never take the profits as "income". If a billionaire sees his stock portfolio appreciate by $100 million in a year but doesn't sell any of the stock to take the profits, then s/he pays no tax at all on the increase in wealth. Not fair!


Safety is everyone's business
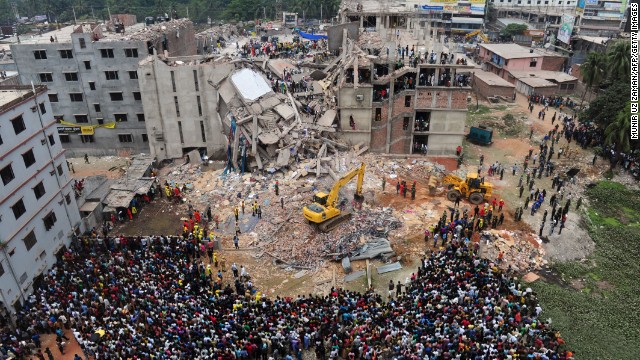
It is one month since an eight story building collapsed in the outskirts of Dhaka killing more than 1000 people. Reporters have been assigning responsibility to prevent similar disasters. It occurs to me that the responsibility for safety is shared. Here are some of the responsibilities:
- The workers themselves have a responsibility for their own safety. I might have suggested to any one of them that she not work in a dangerous facility. I might have suggested that collectively they might have gone on strike until the company provided a safer workplace. Unfortunately, a worker who refused to work in an unsafe workplace in Bangladesh might starve.
- The workers in the garment factories are often unmarried young women, and one might thing that their families should take more responsibility for their safety. Unfortunately, their families are also poor and poorly equipped to take economic risks to protect the young workers.
- The managers and supervisors in the garment factories have a responsibility for the safety of the workers as well as for their own safety. They might insist that the companies provide safe working places. Of course, they would likely be replaced by less ethical people if they did so, and might have problems finding other jobs.
- The owners and stockholders in the manufacturing companies have a responsibility for the safety of the workers. To the extent that that responsibility is shared, it can be avoided. Their profit margins are slim, and might disappear driving them out of business were they to really protect the safety well. Moreover, some are greedy and unethical, and those are willing to make money off of the risk of their workers.
- Building owners have a responsibility for the safety of the buildings that they are renting out. Their incentives are similar to those of the company owners.
- Builders have a responsibility not to build unsafe buildings. Of course, if they refuse contracts to do so, other more greedy and less ethical builders may do so to get the contracts and the ethical builders may lose or go out of business. The builder may also depend on architects and engineers to design safe buildings, and be professionally unable to judge the safety of the buildings that they are constructing. The builders who built the original five stories of the building that collapsed apparently constructed a safe structure until others added the unsafe additional three stories that over stressed foundations and the structure of the lower floors.
- Architects and engineers have an ethical responsibility for the safety of buildings constructed under their professional oversight.
- Governments have a responsibility for the safety of the workplace and construction. However that responsibility is limited by the legal authority given the government. More practically, it is limited by the expertise and resources available to the government agencies. And of course government employees may be corrupt of lazy.
- Of course, people seeking to profit from the risks taken by the workers tend not to like government regulation, and often have the economic and political power to resist it.
- The public in Bangladesh has the responsibility for its own institutions. It must assure that people who endanger workers through greed or corruption are prosecuted, that regulations are strong enough to protect the workers, and that government is strong enough and ethical enough to enforce the regulations. Unfortunately, that is a shared responsibility and thus easily avoided. Bangladesh is also poor in financial and human capital, and the public may not be able to demand a government that is adequate to protect the workers.
- Downstream companies that profit from the risks borne by workers in Bangladesh's garment factories also have a responsibility for the safety of those workers. They are poorly placed to assure that safety both geographically and administratively. Of course, by avoiding that responsibility and taking advantage of low prices, they make more money. Moreover, the company that pays the price of the safety of those upstream workers depends on the ultimate consumers being willing to pay more for the final product.
- International organizations don't have the authority to demand that products sold in international markets are produced by workers whose safety is adequately protected.
- In theory governments could regulate to assure that imported products were produced by safe workers. The United States for example has regulations to assure that imported drugs are produced in such a way that they are safe for American consumers. We have not charged our governments to provide this kind of regulation.
- Consumers have an ethical responsibility not to safe a few cents per garment that they buy if that saving comes at the expense of the safety of the workers producing those garments. Of course, an individual refusing to buy a shirt at Walmart is not going to protect a worker in Bangladesh. Consumer pressure can only be influential if it is organized.
- So how about the civil society organizations that could organize consumers? How about the media that could inform the consumers enabling their anger to fuel organization and fund NGOs? Well I haven't seen reporters and editors blaming themselves for focusing on meretricious stories rather than important ones.
So workers in poor countries will continue to suffer injury and death, and we will continue to get cheep consumer goods via global corporations.
Wednesday, May 22, 2013
A thought about quantitative evidence
Evaluation professionals seem to emphasize quantitative evidence over qualitative. It is more important to get evidence that contributes to the kind of understanding that will lead to decisions that improve the situation, than to get evidence that satisfies the aesthetics of evaluation professionals.
When you can measure what you are speaking about, and express it in numbers, you know something about it; but when you cannot measure it, when you cannot express it in numbers, your knowledge is of a meagre and unsatisfactory kind.
Sir William Thomson, Lord Kelvin
Not everything that can be counted counts and not everything that counts can be countedThe problem is, of course, that many people seem to utilize quantitative data in their analysis whether or not it counts. Your knowledge may be of a meagre and unsatisfactory kind, but if it is all you have and it applies to the problem at hand, use it!
William Bruce Cameron

I am the manager of the Monitoring and Evaluation group on Zunia. I am also a member of the Monitoring and Evaluation Professionals group on Linked In. In the contexts of those groups I have been worrying about the framing of questions.
Let me give an example. I recall a colleague in a developing country telling me that he had been having difficulty understanding why health indicators were so poor in one region. He had come to realize that public health services were very deficient in that region, but that only led to a further question. Why were public health services not focused on a region with evident public health problems. It was only when he recognized that the region was the stronghold of the opposition to the party in power in the central government that illumination dawned. The problem was not one of health services, but a political problem -- the government policy under the current leadership was one of retribution against its political opponents. The government was doing everything possible to make the people of the region suffer economically, politically, and even with poor health.
If one had tried to "evaluate" the public health service and its "impact." without understanding the political and economic situation, one would have been gravely misled. One might have recommended strengthening the public health service budget and staff (and dealing with poor morale of service providers) in the assumption that a stronger health service would improve health status. Recommendations of that nature would almost surely not have been implemented; if implemented they might have had little impact on health status which depends on nutrition and water and sanitation; with high levels of unemployment, high levels of poverty, and poor governmental services health status might not improve even with improved health services.
The point is that it is important to ask the right questions if you want the answers to lead to real development. Generally the way to be sure to ask the right questions is to ask a lot of questions in the hope that at least some will pay off. Asking questions that only quantitative evidence can answer is probably not sufficient to really understand the situation. Of course, where quantitative evidence is available, it can often be very useful when taken in context.
Tuesday, May 21, 2013
Park Avenue: money, power and the American dream - Why Poverty?
Monday, May 20, 2013
A proposed App for smart phones to be used in primary health care in developing nations.
Here is an idea for a class of apps for smart phones. The apps would provide guidance on when and how urgently one should seek medical attention. For example, a cell phone app might help health promoters to decide when a patient should seek emergency medical attention or could wait to make an appointment for outpatient care in a few days.
 |
| Image source: Medical Informatics |
I suggest that such an app might improve recording of patient information and decision making. I have been impressed that while we assume that clinical personnel do not make mistakes, in fact they do. Use of formal probability models to improve decision making may help. Moreover, the example based on delegate medical responsibilities in a developing nation setting is consistent with the thrust of this blog, but the approach could be used by primary care physicians in the USA (on their tablet computers) or by patients with their own smart phones.
I have previously done a series of posts suggesting the procedures needed to estimate the a priori probabilities and to update them based on added information.
- Probability Analysis to Improve Scientific Peer Review
- Subjective Probabilities, Ratings, Handicappers, and Open Access Online Scientific Literature
- From Estimating Probabilities of Ratings to Figures of Merit and Rankings
- Peer review in ex ante and ex post evaluation: probability based improvements in vote tallying.
There might be some minor changes. For example the adjustments of probability estimates made in the above papers assume that the added pieces of information are statistically independent. In the example above, it might be that symptoms in a syndrome would not meet that requirement. The modification would probably be simple.
Classification is the basis of science: science is the basis of modern medical technology

The Diagnostic and Statistical Manual of Mental Disorders, Fifth Edition will soon be the bible of clinical psychology and psychiatry. The Economist has devoted a major article to the DSM. I quote from that article:
The third DSM, published in 1980, introduced a new approach—also followed in the fourth in 1994. DSM-III acknowledged that psychiatrists had a poor understanding of the physiological cause of mental illness. Instead specific, observed symptoms became the diagnostic criteria, and clusters of them, known medically as syndromes, that appeared to coexist in individual patients were given labels. The hope was that biological markers of such syndromes would be discovered as physiological understanding increased.......
The new DSM aspires to include objective criteria in its manual. It also seeks to scrap nonsensical, strict lines between certain disorders........
(A) group called the Psychiatric Genomics Consortium, which has looked for links between genetic variations and psychiatric disorders in tens of thousands of patients, has found that variations in four places were common to people diagnosed, using the DSM’s criteria, with attention deficit hyperactivity disorder (ADHD), autism, bipolar disorder, major depression and schizophrenia. Likewise, a series of papers over the past decade have shown similar abnormal activation of part of the brain called the amygdala in people diagnosed with anxiety, major depression and post-traumatic stress disorder.Neurosctientists and clinicians specialized in mental diseases are seeking to develop a taxonomy that links symptoms and syndromes to specific malfunctions in neural structures and processes. To the extent that they succeed, they may hope to develop better diagnosis for mental disease and more effective treatments to prevent, cure and ameliorate mental illness.
I suspect that this effort and the effort to improve learning and mental performance will be an important area of technological innovation in this century.

Container Shipping -- A key technological innovation
 |
| Source: The Economist |
(B)etween 1966 and 1983 the share of countries with container ports rose from about 1% to nearly 90%, coinciding with a take-off in global trade,.......In a set of 22 industrialised countries containerisation explains a 320% rise in bilateral trade over the first five years after adoption and 790% over 20 years. By comparison, a bilateral free-trade agreement raises trade by 45% over 20 years and GATT membership adds 285%.
Though containers brought some early savings, shipping rates did not drop very much after their introduction......More important than costs are knock-on effects on efficiency. In 1965 dock labour could move only 1.7 tonnes per hour onto a cargo ship; five years later a container crew could load 30 tonnes per hour (see table). This allowed freight lines to use bigger ships and still slash the time spent in port. The journey time from door to door fell by half and became more consistent.The technological innovations that cut transportation costs and transportation delays were obviously key elements in globalization. Innovations in communications were obviously also very important as were the improvements in computer technology that led to improved port and shipping management.
I underline that there were many complementary innovations -- containers were shipped on bigger ships, meaning that ship building had to change. Port technology changed to allow the containers to be lifted whole from the ships. Trucking changed to accommodate the containers. The technology to keep track of the containers changed, as did the technology to keep huge ships on the sea as much as possible.
Just because we don't see a technological revolution doesn't mean that it isn't changing our lives!

Sunday, May 19, 2013
Saturday, May 18, 2013

Friday, May 17, 2013
Income inequality in developed nations -- why the United States shows so badly
 |
| Source: OECD |

Of course, the Republicans in Congress would not want to increase taxes on millionaires and billionaires just to provide food stamps to assure that poor kids don't go hungry.
Wednesday, May 15, 2013
Peer review in ex ante and ex post evaluation: probability based improvements in vote tallying.
In this 4th in a series, the use of probability analysis to improve the information content of ratings and rankings is extended to ex post evaluation of projects as well as ex ante review. The approach could be used in a variety of development projects. It might even be used in the context of village decision making.I have recently added a series of posts on the use of probability theory, especially Bayes rule, and information theory to quantify peer reviewer information.
- Probability Analysis to Improve Scientific Peer Review
- Subjective Probabilities, Ratings, Handicappers, and Open Access Online Scientific Literature
- From Estimating Probabilities of Ratings to Figures of Merit and Rankings
While the first posts focused on scientific peer review, the approach could be used in ex ante review of any set of alternative proposals. It could also be used in ex post review of completed projects, that is in their ex post evaluation. Let me suggest a very different application to illustrate the point.
A Village Level Example
Think about a village in a developing nation in which a number of development projects are possible. It is desired to develop community participation in the ex ante selection of projects to implement, and to obtain community evaluations of the success of the projects when completed. In such villages it is sometimes difficult to get people to give their real opinions in public, where they may be different than the opinions of village chiefs, those of their family members, or of a perceived majority. It might be that a hole-in-the-wall computer would allow community voting in a less threatening situation. (The computer could of course carry out many other functions while not being used for voting and improving the interpretation of the votes.)
A hole-in-the-wall computer might be installed in the village, including a card reader that could be used to identify the current user. For example a plastic card like a credit card might be given to each adult in the village identifying that person. Perhaps a touch screen could be used to allow people to vote on projects, and the projects could be identified by photos (as well as text) to allow illiterate adults to vote. (Note that readable ID cards would also be useful for other applications, such as for health information provision.)

A meeting could be held with the community to build interest in and support for community development through community projects. In the meeting, the participants could learn to use the computer to vote on projects. In the learning process they could record some judgments on hypothetical projects; doing so could be done in such a way as to increase enthusiasm for the project based approach to development. It would also provide a basis of data for the process described in the above references.
People might for example give one to five stars to each project, such as is done in Amazon.com reviews of books. The projects could be ranked according to the average number of stars given by community members.
Once the initial meeting was complete, a list of projects could be programmed into the computer and the village invited to vote within a given period. Initially, the selection of the first projects to implement might be simply by summing the number of stars given for each project, divided by the number of voters participating.
When projects were completed, the community could be invited to rate the success of each, using the same scale for the voting. Indeed, one might have a vote at the completion of the project on how well the project went, and a later vote on how much the community liked the service provided to it as a result of the project.
When enough data had been built up on the rating performance of the community members, the approaches described in the previous posts could be used to refine the interpretation of the voting.
Scale Up of the Idea
A rural development program might include hundreds of villages, each of which might use the technique to improve decision making and to track the quality of its projects.
Consider instead of a village, using the approach in a city. Commissions such as land use planning commissions could be provided with software using the statistical approach that I have described for selection of projects. It might even be useful in something like a grand jury context.
Similarly one might identify a thousand citizens of a community as a standing committee to evaluate local government performance. At any time, a number of projects and services might be listed on a website for the standing committee, and the members invited to enter their evaluations. At start up of the effort (or affiliation of a new member), a number of past projects might be evaluated to obtain required information on member evaluation performance. Then results might then be used by government officials in their management, or published to promote open government.
A donor agency might fund a program to strengthen intermediate cities, perhaps to provide an alternative to excessive growth of the largest city in a country to to provide for alternative poles of development. The approach could be used in each of the secondary cities.
Other Applications for Improvement of Review Performance
There would appear to be many other applications. Some possibilities are:
- Finance: Donor agencies provide support to banking institutions, and the decisions on individual loans by banks would seem a likely application for probabilistic approaches to improve choice and evaluate choices made. This may be especially true in microfinance projects.
- Technology innovation projects, in which large numbers of grants or loans are made to technological entrepreneurs, either to develop new technologies or to develop new small enterprises based on technological innovations.
- Education projects that use peer review of teacher performance.
- Health projects that use expert review of primary health worker performances. Peer review may also be introduced into hospitals where physician peer review is done of cases treated in the hospital.
Use your own imagination to construct other ways of voting on ex ante and ex post evaluation of alternatives using the probabilistic approach.
Monday, May 13, 2013
Three Good Websites from the World Bank
Here are three good websites from the World Bank. Two are . They should interest readers of this blog:
- Knowledge Management -- from the Knowledge for Development (K4D) program: This initiative "aims to enhance the capacity of development-oriented organizations in the client countries to achieve greater impact through the application of knowledge management tools and practices."
- The Knowledge Economy: "In the past few decades, the Bank has gained significant experience involving over $4.2 billion financing related to projects in Innovation Systems and Knowledge Economy area. These interventions have been most extensive in building National Innovation Systems. (including upgrading MSTQ systems, strengthening Intellectual Property Rights Regimes, restructuring public R&D Institutions, establishing venture capital funds, supporting firm-level innovation and technology development, setting up technology centers and Technoparks, etc.) This divergent, varied and extensive experience in assisting client countries to enhance growth and competitiveness has been accumulated in various pockets across the Sectors and Regions of the Bank."
- Science, Technology, and Innovation - Publications: World Bank reports explore various aspects of science, technology and innovation policy in developing countries. Of the many publications produced by the World Bank, the website provides a selection that may be of particular importance in today’s context:
The United States continues to invest heavily in knowledge-based capital
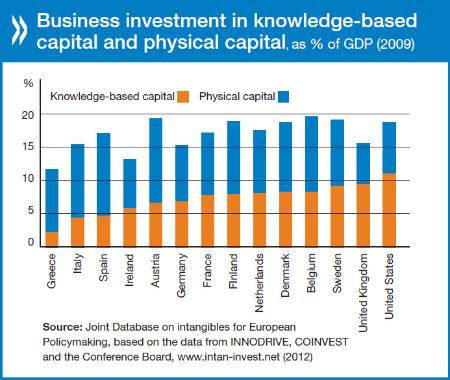
The growing awareness that knowledge-based capital (KBC) is driving economic growth is prevalent in today’s global marketplace. KBC includes a broad range of intangible assets, like research, data, software and design skills, which capture or express human ingenuity. The creation and application of knowledge is especially critical to the ability of firms and organisations to develop in a competitive global economy and to create high-wage employment.
Knowledge is Growth (OECD STI Directorate)
Thoughts from Chris Argyris

Chris Argyris contributed a lot to management theory. Here are some of his lessons from a recent newspaper article:
- knowledge is of minimal use unless it enables the recipient to take action
- it is harder, not easier as we would expect, to teach smart people how to learn
- focus on not just how to deal with the problems in a project, but why the project was undertaken in the first place and whether a better approach might work better.
A physician told me a long time ago that a rule of medicine is never to make a patient undergo a test unless the result will lead to some action (or avoid some action). That seems like good advice. Obtaining information costs money. Indeed, in an organization, obtaining information tends to use people's time and good will.
Saturday, May 11, 2013

From Estimating Probabilities of Ratings to Figures of Merit and Rankings
This is the third in a series of posts on quantitative approaches in reviewing scientific proposals and publications. The first two are:
Two previous posts advocated a quantitative approach to peer review based on probability theory, Bayes rule and information theory. This post focuses on a figure of merit for ranking of submissions and a sequential process that seeks to maximize information where it is most needed deciding among submissions.
- Probability Analysis to Improve Scientific Peer Review
- Subjective Probabilities, Ratings, Handicappers, and Open Access Online Scientific Literature
- Those so highly rated that they clearly were to be funded;
- Those rated so low that they clearly were not to be funded;
- A third group near the "cut off line" which might either be funded or not funded.
It doesn't much matter whether a proposal is ranked first or fifth in a set of 1000 if one is to fund 150; in either case it would be funded and the ranking is purely an internal aid to decision making. Nor does it matter much whether a proposal is ranked 700th or 800th as in either case it would not be funded. But it would matter a great deal whether it were ranked 150th or 151st. That difference might determine which of the two was funded and which was not, with a significant influence on the careers of the scientists involved.
Note however that the rating of proposals are subjective judgments. The rankings depend on estimates of what is likely to happen in the future if the research is funded. The judgment is made on the basis of a research proposal, and all research proposals are approximations. Moreover, reviewers are always less interested in the proposals that they are reviewing than in their own work, and are usually busy with other responsibilities. The uncertainty about the outcomes of the 150th and 151st proposals is almost certainly greater than the actual differences between those potential outcomes.
Still it is useful to have a defined procedure with quantitative indicators to formalize decision making. Such a procedure can be satisfying to both those managing the review process and those submitting proposals.
 Consider the use of a figure of merit for proposals. I suppose that the standard approach would be to use the average of reviewer ratings for a proposal.
In the previously described procedure of sequential independent peer reviews, one might use the sum of the rating times its probability over all ratings for a given proposal. In the example, with ten possible ratings, they might be assigned values one through ten. The highest possible figure of merit then would be 10, were a proposal to have a 100% probability of the highest rating; the lowest possible figure of merit would be 1, were a proposal to have a 100% probability of the lowest rating. As described in the previous posts, such an indicator would incorporate more information on the reviewers and the correlations among ratings than would a simple average of ratings.
At any point in the review process, proposals could be rank ordered by their figure of merit.
- Before the first reviews, all proposals would have the same figure of merit, since all would be characterized by the same a priori probability distribution of proposals over ratings.
- After one review was received for each proposal, all proposals would have one of ten values of the figure of merit, since the first review could have only one of ten ratings. However, at that point the probabilities of the values of the ratings for the second review could be estimated. These would form something like a distribution around the actual rating received. The proposals could then (if desired) be shown on a graph. The X axis would be the rank order of the proposal; the Y axis would be the figure of merit and the possible figures of merit after the second round of reviews.
- After the second round of reviews there would be more values of the figure of merit for proposals and narrower bands of potential values of the figure of merit. These too might be graphed.
- Eventually the graph of the figure of merit versus rank order of the proposal would appear almost continuous.
At an early point in the process it would become apparent that no further reviews would be needed for some proposals. Those with very low estimated figures of merit could be eliminated from further reviewing since they clearly would not be funded; so too eventually some proposals would have figures of merit so high, and variance so low about their figures of merit that they would surely be funded. Evaluation effort could then focus more on the proposals still in doubt.
For example, while a couple of reviews might be required for all the proposals, perhaps a third review might be needed for only half of them, and further reviews for smaller and smaller portions of the field. Such a procedure would greatly reduce the demand on reviewers.
As a result the range of likely values of the figure of merit would be broader far from the competitive range (where relatively few reviews were used) and narrower in the competitive range (where there would be more reviews).
Thus, the effect would be to get more and more precision in the Figure of Merit for the proposals in the competitive range.
Note too, that in a final selection, one could look at the probability distributions of the ratings of the borderline proposals to be sure that there was a suitable high probability that the proposals being funded merited a higher rating than the proposals being rejected.
Is global warming real?

As greenhouse gases increase, so is global warming likely to take place, warming of the oceans, and rise in sea level. There will be major changes in local climates, and changes in the intensity and frequency of extreme weather events. Agriculture in many places will suffer; in some places people will have to migrate to survive.
Subjective Probabilities, Ratings, Handicappers, and Open Access Online Scientific Literature
In a previous post I proposed an iterative process that can be used sequentially add information to the rating of research proposals, providing quantitative results. This post extends that method to show how information on the source of the proposal and the source of the review can be used to improve the results. It also provides a measure of the information provided by the review at each stage. The method is extended to rating open access online scientific publications and non-peer reviewers.

The economic model in the past has been that professional societies sponsored journals, and their members paid dues to the societies which paid for the publishing and distribution of those journals. In other cases, scientific publishers published the journals, financing their publications via subscriptions to the journals.
Increasingly, the open-access costs are paid with the submission of papers or when they are accepted for publication. Governments and foundations that finance research are increasingly paying for the costs of the publication of results from the research that they finance.
In both cases, peer review was used to select the articles to be published in the journal. The peer review was used to select the superior submissions which would then be published. Major journals such as Science and Nature publish only one in ten papers submitted to them. Peer review by such prestigious journals was doubly effective in that scientists would not go to the effort of preparing and submitting papers to them unless they believed that the paper would have a decent chance of being published.
I quote from the article:
Outsell, a Californian consultancy, estimates that open-access journals generated $172m in 2012. That was just 2.8% of the total revenue journals brought their publishers (some $6 billion a year), but it was up by 34% from 2011 and is expected to reach $336m in 2015. The number of open-access papers is forecast to grow from 194,000 (out of a total of 1.7m publications) to 352,000 in the same period.
Open-access publishers are also looking at new ways of doing business. Frontiers, for example, does not try to judge a paper's significance during peer review, only its accuracy—an approach also adopted by the Public Library of Science (PLoS), a non-commercial organisation based in San Francisco that was one of the pioneers of open-access publishing. It thus accepts 80-90% of submissions.The New York Times recently published an article describing a problem that is emerging with the increase in open-access, online publishing. There is now a
parallel world of pseudo-academia, complete with prestigiously titled conferences and journals that sponsor them. Many of the journals and meetings have names that are nearly identical to those of established, well-known publications and events.........
The number of these journals and conferences has exploded in recent years as scientific publishing has shifted from a traditional business model for professional societies and organizations built almost entirely on subscription revenues to open access, which relies on authors or their backers to pay for the publication of papers online, where anyone can read them.........
But some researchers are now raising the alarm about what they see as the proliferation of online journals that will print seemingly anything for a fee. They warn that nonexperts doing online research will have trouble distinguishing credible research from junk. “Most people don’t know the journal universe,” Dr. Goodman said. “They will not know from a journal’s title if it is for real or not.”The NYT article was informed by an earlier article in Nature, part of its series on the future of scientific publishing.
About Peer Review
I spent more than a decade managing peer review processes, and came to some conclusions about them. First, it is important to find real "peers", people who are not only experts, but whose expertise is truly applicable to the things that are asked to review. The peer reviewers must be carefully prepared with instructions as to the criteria for their evaluations. Ideally they should be experienced, so that they will have learned how to do peer review well. They must be motivated, in part by their understanding of the importance of their task; in person peer review where they must defend their judgments before other scientists also prove motivating. Care must also be taken to assure that no biases creep into the peer review.
 |
| IMDB entry for "10" |
I recently posted on this blog presenting a method, based on experience in peer review, to quantify the subjective probabilities associated with peer review.
The Information Provided by Peer Review
The entropy of a probability distribution over a set of ratings is defined as the average uncertainty, as in the following equation:

Reviewers Are Not All Equal
There are known biases in peer reviews. Some reviewers have a central bias, tending to concentrate ratings in the center of the scale; others do the opposite, tending toward ratings at the upper and lower extremes of the scales. Some reviewers are notably sour, tending to give low ratings in most reviews; others are generous, giving higher than average ratings.
I even found one reviewer who had a negative correlation with the other reviewers with whom he was associated!
If you have data it is possible to establish a set of estimated probabilities P(Ai / Aj) that the average high quality reviewer rating would be Ai if the specific reviewer gave a review Aj. Thus one can adjust the sequential review process described in the previous post to account for the individual tendencies of each specific reviewer. Contact me if you need more specifics (john.daly@gmail.com).
Entropy as a Measure of Reviewer Quality
Consider a table of rating frequencies. Each column corresponds to one of the ratings by the reviewer of interest. The cells in that column provide the count of ratings by other reviewers for those submissions that received the given rating by the target reviewer. An illustrative table is shown below:
.jpg)

The entropy can be divided between the entropy of the distribution of the target reviewer's ratings and the average entropy of the probabilities of other raters given the target reviewer's ratings. (The proof of that statement is too long to be given here.)
If a target reviewer tends to give some ratings much more frequently than others, the information per rating is reduced.
In the table shown, the target reviewer ratings are highly predictive of those of the other reviewers. In such a case, the entropy is low. On the other hand, if there is wide variation between the target reviewers ratings and those of other reviewers, and the entropy is high, little information is gained from the target reviewer's ratings. Thus, the more the probability columns for ratings 1 through 10 look like the column on the right, the higher the entropy, and the less value in the target reviewer's ratings.
A further calculation might be useful, and that is the correlation between the ratings of the target reviewer and other reviewers, since it is even possible that a high rating by one reviewer might predict low ratings by other reviewers. One might identify a positive or negative correlation by eye. One might go further, for example calculate the probability of agreement between the target reviewer rating and other reviewer ratings, the probability of a difference of plus and of minus 1, of plus and minus 2, etc. That would provide a probability distribution.
Submiters Are Not All Equal
It is a poorly hidden secret that some scientists are more successful than average in having their proposals funded and their papers published. This of course is partly due to the fact that some scientists regularly propose better than average projects and write better than average papers.
Where reviewers can identify the person responsible for the submission that they are reviewing, they may rationally modify their estimates of the a priori probability that the submission is going to be good. A serious and expert reviewer will of course use the information obtained from a detailed reading and consideration of the submission, but will also use other information ooncerning the source of the submission.
What About non-Peer Review?

I think the Amazon.com process of having customers give ratings between one and five stars is prototypical of a process providing information to the online reader from people who may or may not be experts. Amazon.com uses a star rating system (example shown above). One presumes that the number of stars represents the quality of the offering as compared with other similar offering from Amazon.com. Some of the people providing ratings are experts. Thus in the case of a book of history, some will be professional historians whose research is closely related to the book they are rating. They may or may not be "peers" of the average reader. The 8 reviewers who gave one star (in the example above) to a book that had 264 five star and 136 four star ratings may have been right, but more probably they were not giving accurate ratings.
Amazon.com improves the rating system by asking people not only to give a rating but also to provide a review. It then asks customers to rate the reviews according to how useful they found them. Thus the reader can judge the quality of the star rating with added information on the review.
Handicappers, Horse Racing and Probability Estimates
It is known that the odds in pari mutual betting match closely the odds that the horses will actually win the race; if the betting odds are 3 to 1 for the favorite, the favorite will win about a quarter of the time. How can that be?
Part of the answer is that horse racing fans are rather good at estimating the probability that horses will win races. The study the horses, the breeding, the training, and past performance and make their judgments. Their subjective judgments on probabilities are not uninformed.
Moreover, there are professional handicappers who are paid for making the odds on horse races, and those odds are published. They are available in newspapers or in tip sheets sold at the race track. Punters take the handicapper predictions into account in making their own judgments.
In betting the actual pari mutual odds are based on the amounts bet, not the number of betters. The casual race course visitor may make a $2 bet on his inexpert judgment. The informed professional gambler will make much larger bets when the odds seem right. Thus the amount of the bet carries implicit information on the credibility of the punter's estimates of probability. The larger bets of course have more influence on the final pari mutual odds.
So What?
The procedures described above can not only provide quantitative estimates of the quality of scientific papers (or books or movies), but can be used to improve those estimates sequentially as more and more reviews are received. They can also provide quantitative estimates of the amount of information in the current rating. They can be modified to include information on the track record of the author of the submissions and on the past performance of the reviewers.
It would seem to be important to find such means to help scientists choose which papers to read in the burgeoning corpus of open-access online scientific papers. They may even find use by online vendors such as Amazon.com and eBay.com.
Subscribe to:
Posts (Atom)