Showing posts with label peer review. Show all posts

Sunday, April 05, 2015

On getting good information from peer review meetings


I read an interesting column in The Economist on getting good results from meetings. I quote extensively from that Free Exchange column:
In 1785 the Marquis de Condorcet, a French mathematician and philosopher, noted that if every voter in a group has a better-than-even chance of choosing the preferable of two options, and if voters do not influence each other, then large groups of voters are very likely to make the right choice.* The bigger and more diverse the group the better: more people bring more information to the table which, if properly harnessed, leads to improved decisions. But ever bigger meetings imply more time spent in them: few workers would welcome that. And even with more people in the room, all manner of behavioural flaws stand in the way. 
One problem that obstructs sensible decision-making is the “halo effect”—“owning the room” in the parlance of Silicon Valley.......A second problem is called “anchoring”. In a classic study Amos Tversky and Daniel Kahneman secretly fixed a roulette wheel to land on either 10 or 65. The researchers span the wheel before their subjects, who were then asked to guess the percentage of members of the United Nations that were in Africa. Participants were influenced by irrelevant information: the average guess after a spin of 10 was 25%; for a spin of 65, it was 45%. In meetings, anchoring leads to a first-mover advantage. Discussions will focus on the first suggestions (especially if early speakers benefit from a halo effect, too). Mr Kahneman recommends that to overcome this, every participant should write a brief summary of their position and circulate it prior to the discussion...... 
Tom Gole of the Boston Consulting Group and Simon Quinn of Oxford University studied the votes of judges at international school debating tournaments. In these tournaments, three judges are randomly assigned to each debate (with some controls to ensure each panel has a mixture of experience, gender and so on). Judges watch the debate, then immediately vote on the winner before conferring. Crucially for the experiment, the participating teams are seeded. Using some whizzy statistical modelling, the authors find that if a judge disagrees with her fellow panellists in a given round, she is more likely to vote for the pre-tournament favourite—the higher-seeded team—in later debates. That suggests, say the authors, an unspoken desire to avoid “too much” disagreement. 
Career concerns may distort incentives even if votes are secret. In a 2007 paper Gilat Levy of the London School of Economics noted that observers can work out how likely it is that committee members have voted one way or another from ballot rules. If unanimity is required for a measure to pass, and it does, then outsiders will know with certainty how every member has voted. A simple majority rule means that observers can assign at least a 50% probability to any one committee member having given their assent; if a majority of two-thirds is required, the probability that any given member has supported the proposal goes up. The incentive to vote against controversial measures rises the greater the likelihood that each member will be blamed for its passage.
I have posted a number of times on peer review (check the "peer review" tag to get them all. What we did to get good results in the peer review of research proposals was:

  • To try to screen at a preproposal level to be sure we were asking reviewers to look at decent proposals (and to save proponents from writing detailed proposals with little chance of being funded).
  • Criteria for approval of proposals were carefully defined and described. (Note that the purpose of the program determines the criteria; our program was intended to build capacity to do research in developing countries, and sometimes a proposal strong on this criterion would be funded while a stronger scientific proposal with less capacity building involved would not be funded.
  • To group proposals into small groups on related topics, and send each to a primary and secondary reviewer. They would be asked to write a review and rate the proposal prior to the meeting.
  • The primary and secondary reviewers for all the proposals in a single group would form a panel. All the proposals would be sent to each member, and all the members of the panel were expected to read all of the proposals before the face-to-face panel meeting. (Normally, something like 8 to 10 proposals would be reviewed by a single panel, and normally a single reviewer would not be the primary reviewer on more than two proposals, nor the secondary reviewer on more than two.)
  • In the meeting, the proposals would be discussed one at a time. The primary reviewer would speak first on a given proposal, and then the secondary reviewer would speak. There would then be a general discussion, after which, the proposal would be rated by all of the reviewers individually. The average rating would be calculated. Proposals at this stage would also be judged by consensus to be potentially worthy of funding or so flawed in some way as not to be worth funding.
  • When all the proposals had been reviewed, discussed and rated, they would be ranked from best to least useful by consensus of the panel. The average rating would be a guide to the ranking, but we discovered that sometimes after discussion a panel would find that comparing two proposals they would rank that with the lower rating to be in fact more worthy of funding and thus of higher rank.
  • At all panel meetings we would have at least two people to judge the panel discussion -- one from our office and one from the National Academy of Sciences staff. If the judges determined that the review was not adequate for some reason for one or more of the proposals, additional reviews would be sought and a final decision would be taken by our staff.
  • We would then allocate our total budget among the top rated projects (all of course specified as worthy of funding by their respective panels), using the ratings as a guide as well as the observations of the panel reviews.
The program was part of the foreign assistance effort of the U.S. Government, and the reviews were held in the Washington D.C. area, which has a very large and strong scientific community. We found that local scientists were willing to do the reviews and come to peer review meetings without fees or reimbursement of costs if we selected from the local universities, laboratories or government agencies. Ours was a relatively small program. Reviewers seemed to enjoy the experience.


Friday, February 07, 2014

Thoughts as I begin Reading Gaddis on the Writing of History,


I have just started reading The Landscape of History: How Historians Map the Past by John Lewis Gaddis. As I start to think about reading history, I am again taken by the passionate beliefs that people of the past have so often had in ideas that we now understand to be completely wrong. It is obvious that history should teach us that our own ideas may be wrong; consequently some modesty about our beliefs is probably justified not only by our own unrecognized limitations, but also by the fact that our ideas are formed by those with whom we associate, the ideas current in our time -- the zeitgeist, if you will. History suggests that the zeitgeist is almost always wrong.

If throughout history most people were wrong about most important things, perhaps we should treat our contemporaries who we believe to be wrong now with a some respect and more than a little courtesy. Hard as it is to believe, they may be right and we may be wrong.

Emotion in History

Gaddis points out that historians often try to get their readers to recognize the emotions felt by historical actors, not just what they thought. Daniel Kahnemann, the psychologist, has a model describing two kinds of thinking:
System 1 is fast, instinctive and emotional; System 2 is slower, more deliberative, and more logical. (Wikipedia)
I assume that most of us read history using System 2, the more logical and less emotional kind. It may be very difficult to convey emotion to a reader in system 2 mode. (Perhaps those who wrote epic poems, who could use the rhythm of language and metaphor had a better idea on how to convey historical fact and emotion.)

Time and Space

Gaddis points out that historians manipulate time and space in writing histories.

We think of space in terms of maps, or these days the GPS which tells us the mileage and expected duration of a trip as we start out and along the way. But that is not the only way to think of space. A couple of hundred years ago, our American founding father's would probably have been concerned about how long an overland trip would take on horseback; how long a sea voyage would last. A voyage across the Atlantic might take six weeks or two months, or much longer if the weather was bad. The trip would take different times in different seasons. It might be important to consider the danger involved in different routes. Thus a person setting out on a long trip in 1776 might better consult a list of options with pros and cons for each, rather than a map.

The Romans built a road system that enabled their legions to move with unprecedented speed. Roman roads didn't get muddy, and provided rapid transport in the Mediterranean climate in all seasons. They had mile markers so that distances could be accurately understood in planning and managing a march. (The word "mile" comes from the Latin word for 1000, since it was the distance traveled by a legion making 1000 of its measure paces on the march.) For the Roman legion, space would have been conceived of in terms of distances moved by sea, by Roman Road, and cross country.

We think that the distance from A to B is equal to the distance from B to A. In 1776, the trip by boat up the Hudson River (and travel often would have been by water rather than land) would take more time than a trip down the river. Measuring the distance by time required for the trip from New York to Albany would be longer than the trip from Albany to New York.

With the development of the transcontinental railway and telegraph, by the second half of the 19th century, people could travel relatively rapidly over long distances by rail, and could communicate even faster over the telegraph. There are stories of people traveling by train, impressed by the speed of their journey, who were amazed to get a telegram on arriving at their destination with news of events from home that had happened after their departure. While people and information traveled relatively quickly along the rail lines and parallel telegraph lines, as one moved away from those lines, speed was reduced again to that of a horse or walking man. Thus distance measured in time was anisotropic, depending on the direction in which the measurements were taken.

I have just read The Rise and Fall of Alexandria: Birthplace of the Modern World by Justin Pollard and Howard Reid. (See my post on the book.) The book illustrated the fact that, while we know a lot about the times at which some events too place two millenniums ago, that information is very spotty. For important Alexandrian scholars and intellectuals, we know very little about when they worked in Alexandria, or even if they did in fact live and work there. In fact it may suffice to know that Alexander the Great founded a city late in the fourth century BC, and that it was conquered by Rome in the middle of the first century BC, and conquered by Arabs in the late seventh century AD.

Theory of Relativity

If there are two events, A and B, we think that either A preceded B, A and B were simultaneous, or B preceded A. Einstein in his theory suggested that that appearance depends on the relative positions of A, B and the observer, and the motion of the observer. There is a analogous historical situation, which seems little studied.

Let us return to the period of the Revolutionary War. A Tea Tax was passed into law in London in 1773. Americans learned of the new law in September many weeks after they passed, when ships were already under way for America with cargoes of tea. In Boston, local leaders raised public anger at the new law for a period of a couple of months, and in mid December a mob dumped the cargo of tea from a ship in the Boston Harbor. It then took many weeks for the word of the word of the "tea party" to get back to London. Note that information about the law and the Boston response affected Bostonians much closer in time to each other than they did to Londoners. If you will, the two events appeared more nearly simultaneous in the minds of Bostonians than in the minds of Londoners.

It you think about the slow and perilous communications in the 18th century, news from London, Madrid and Paris could take quite different amounts of time to arrive in Philadelphia. It would be possible that events would occur simultaneously in Paris and Madrid, with news of the Paris event arriving before that of the Madrid event in London, and that of the Madrid event arriving before the Paris event in Philadelphia. Notions of causality might be quite different in the various capitols.

How We Understand the Past Depends on the Questions We Ask

I began to wonder about the radically different way we now conceive of time and distance, due to technological change, as compared with people in the past. I made my first trip by air in 1945, and it took 24 hours to travel from Boston to Los Angeles. I understand that at that time it was hard to make a long distance telephone call, and that one would contact an operator, who would put the call through, getting back to the person who had initiated the call, sometimes after a period of hours. Today the flight from Boston to Los Angeles is much faster, and the psychological cost of a few hours on a plane is much, much less than that of 24 hours with intermediate stops and little sleep. An internet call via Skype gives you instantaneous connection with imagery as well as voice. The distance is much less.

My father, who immigrated from Europe to the USA in the 1920s never saw his parents again, not able to return to Ireland until after his long-lived parents had passed away. Today I exchange messages on Facebook with cousins in Ireland, England and Australia several times a day; many are in real time, others, like our emails, are asynchronous but done usually within hours. Time used to be a function of the local sunrise and sunset; today, we communicate with whoever is online whenever we are online, no matter where we are located geographically. Call centers in Asia operate night shifts to handle calls from the other side of the globe where it is daytime.

Thus, our current view of time and space is radically different than that of historians of the mid 20th century and earlier, and even more radically different that that of the subjects of history of earlier centuries. Will we ask interesting questions of history from our new perspective? For example, considering the relativity of perception of events described above, did it make a difference? Might. for example, World War I have been averted had information flows been different?

Before railroads and telegraphs, there were a number of means used to signal information over distance faster than a man or horse could ride: smoke signals, mirrors, semaphores, etc. There were also systems such as the royal roads of ancient Persia, the roads and runners of the Incas, and the Pony Express developed to use muscle power to transport information more rapidly than otherwise available, especially for use by the state. Have historians explored the costs and benefits of achieving more timely information via these channels?

Process and Structure

Gaddis provides a chapter on Process and Structure in history, noting that (like some of the physical and life sciences) history often focuses on the processes that led to the development of structures found as a specific point in time. He separates the continuous processes --- those which reoccur with sufficient frequency to be predicted -- and the contingent events, such as earthquakes and plagues that land unexpected in history and change the course of events. Fundamentally, however, historians often seek to discover some kind of process which is going on which explains a sequence of events. Their work is to intuit the process, find the evidence that convinces them of the reality of the existence of the process, and then subject their case to peer review (and of course to the judgement of future generations).

Tuesday, January 21, 2014

Scientific Publications Change Credibility of Hypotheses


There is an article in the science section of the New York Times on the reproducibility of results published in scientific journals. I think that it is based on a misperception of the role of scientific publications.

Let me start with an example. Times of sunrise, sunset, high tide and low tide are very accurately measured and predicted. If a scientific journal were to publish an article on the measurement of such events, those results could be reproduced widely and easily. The science is well established, its credibility assured. Thus no scientific journal would now publish such results (unless of course, the rotation of the earth suddenly changed in an unexpected way).

So suppose a scientist comes up with a hypothesis that the sun rises not in the east, but in the west in a specific place on earth. That is a very surprising hypothesis, one that seems very likely, a priori, to be wrong. He goes there and measures the location of the sunrise for a year, and indeed his data show it to have risen in a westerly direction. He submits an article to a good journal; it establishes he is a credible person, and peer reviewers can find no fault in his methods, so his paper is published. Of course, his hypothesis is still judged to be wildly improbable, but others would seek to replicate his observations. If they did, an important lead would then be available for new discoveries for earth scientists. If, as would be likely, it was found that there was an abnormality in the magnetic field or that his instruments were flawed in a way he had failed to detect, and that the sun indeed rose in the east, that would be the end of it. The results would not be reproduced and confidence would be restored in the prior theory.

Scientific journals seek to publish interesting results, those which show evidence for something that was thought a priori to be unlikely. The most interesting experimental results are just those which most challenge the probabilities as estimated before the experiments. It seems reasonable that these anomalous results will not stand up; that published scientific research will be difficult to reproduce. something is unlikely to be true, as any scientist will tell you, an experiment that indicates it is true is likely to be faulty.

This would seem to be especially true as scientists explore things very far from common experience, where the experiments themselves become very difficult. Think of particle experiments at very high energies, superconductivity experiments at very low temperatures, astronomical observations at very long distances, etc.

An experiment that appears to challenge a well established idea, doing so by achieving very unusual and difficult to achieve experimental conditions, may be very suggestive of new ways to understand the world. Such an experiment would also seem likely to be an artifact

  •  a set of observations that would occur only very improbably, but which by the laws of random chance occurred in a specific experiment
  • a methodological error, difficult to detect, that fell upon a reputable researcher. 
That is why replication is important, and indeed why scientific integrity is important. Often the supporting or challenging evidence will be obtained by alternative experiments, done with different equipment, and done in other laboratories.

So irreproducible results are not indicative of something being wrong with science or scientific publication, but are a natural result of the use of scientific journals to direct attention at potentially important findings as the frontiers of science advance into more and more difficult experimental domains.

This incidentally is why the public should not rush off to demand doctors prescribe a new drug based on reading a newspaper report that it had very unexpectedly cured a condition in an experiment on rats. A single unlikely result leaves the theory still unlikely. Consumers should wait until the FDA, based on the advice of expert, experienced scientists judge that the evidence is then sufficiently credible of safety, efficacy and effectiveness to allow doctors to prescribe the medication.

Monday, November 11, 2013

Predicting citation rates and predicting success in Vietnam.


There is an interesting article in Science magazine last month providing a model of the long term impact of articles in scientific journals. The model recognizes that the more an article has already been cited, the more likely it is to be cited again. It also recognizes that eventually the citation rates for most articles trails off, so that the time since initial publication is a parameter. Finally, the model posits a "fitness" parameter which the authors believe captures the perceived novelty and scientific importance of the content of the article.

This fitness parameter is similar to a parameter that I have described in previous posts as the probability that a paper submitted for publication will be recommended for publication by peer reviewers.

Note, however, these statements by the authors:
Paradigm-changing discoveries have notoriously limited early impact, precisely because the more a discovery deviates from the current paradigm, the longer it takes to be appreciated by the community. Indeed, although for most papers their early- and long-term citations correlate, this correlation breaks down for discoveries with the most long-term citations. Hence, publications with exceptional long-term impact appear to be the hardest to recognize on the basis of their early citation patterns.
And:
The proposed model has obvious limitations: It cannot account for exogenous “second acts,” like the citation bump observed for superconductivity papers after the discovery of high-temperature superconductivity in the 1980s, or delayed impact, like the explosion of citations to Erdős and Rényi’s work 4 decades after their publication, following the emergence of network science.
Of course, that is a major problem with peer review. The ideas that are most likely to be revolutionary or to assume major future importance are not likely to be recognized for their importance when first submitted.


 I thought about this while watching a program on TV on President Kennedy's decision making in 1963 with respect to the Vietnam War. That summer, with some 14,000 military advisers in South Vietnam, Kennedy sent high level teams to the country to complement the regular reporting from the military and the Ambassador as to whether the South Vietnamese government was being successful or not in fighting the insurgency. One of the issues under discussion was whether 1,000 advisers should be withdrawn at the end of 1963 to strongly signal that the government of South Vietnam did not have an open check for U.S. military support.

The problem with this approach seemed to me to be similar to estimating the long term impact of a scientific paper from its early citations. If the situation changes, the biggest future impacts can be missed by projecting current situation data ignoring the risk of those changes. The success or lack of success of local tactics in Vietnam in 1963 did not help in predicting the long long term strategy of the insurgents and their supporters in North Vietnam and the Communist block countries. Short term success of the Southern government troops was met by increased opposition forces and would be until the United States withdrew its troops and until the government of South Vietnam fell.

Monday, November 04, 2013

Scientists don't believe everything they read II.


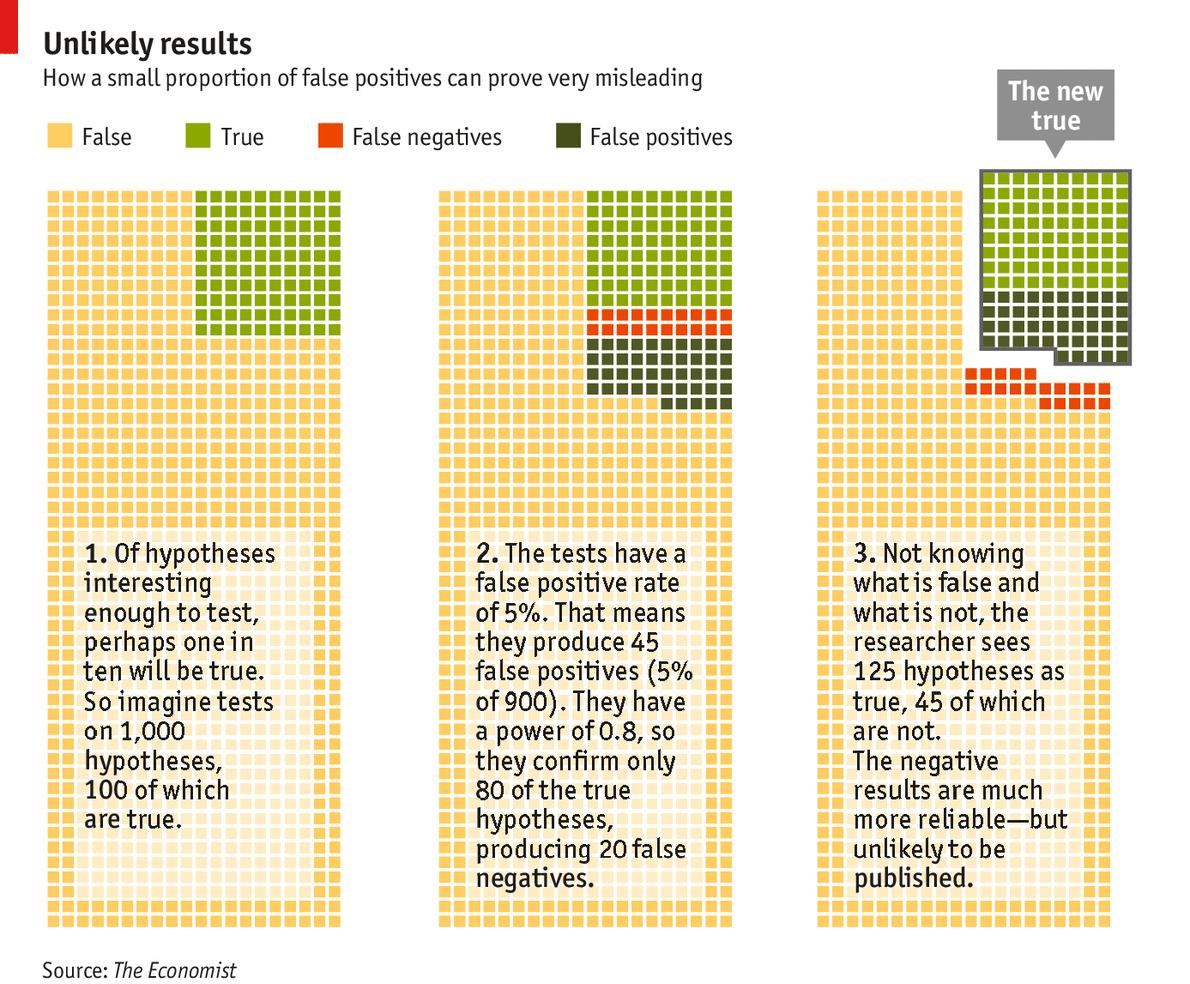
I recently commented on an article from The Economist. I quoted one small portion of the article (that assumes one in 20 incorrect hypotheses will be accepted):
(C)onsider 1,000 hypotheses being tested of which just 100 are true (see chart). Studies with a power of 0.8 will find 80 of them, missing 20 because of false negatives. Of the 900 hypotheses that are wrong, 5%—that is, 45 of them—will look right because of type I errors. Add the false positives to the 80 true positives and you have 125 positive results, fully a third of which are specious. If you dropped the statistical power from 0.8 to 0.4, which would seem realistic for many fields, you would still have 45 false positives but only 40 true positives. More than half your positive results would be wrong.

I noted that in the example, before the experiment the probability of the hypothesis being true seems to be 0.10; after the experiment it seems to be 0.64. Thus the a posteriori probability is much higher given the positive outcome of the experiment.

On the other hand, consider experiments with negative results. In the example, there would have been 20 false negatives and 855 true negatives. The a posteriori probability of the hypothesis being true would seem to be 20/875 or 0.02.

A positive experimental outcome with the characteristics noted indicates that the hypothesis tested seems much more likely to be true; a negative experimental outcome with the same characteristics suggests that the hypothesis that formerly seemed unlikely now seems still more unlikely.

Science advances by the accumulation of evidence and hypotheses are not supposed to be widely accepted until supported by a number of different experiments. Positive results from one experiment do not mean that a hypothesis is necessarily true, but suggest that hypothesis is especially worthy of more investigation. Negative results from one experiment mean that the hypothesis is less likely to be supported by further investigation.

Surely both positive and negative results should be available to the scientific community in our Internet age, but I see a rationale for publishing the positive results more widely.

Scientific journals may well be doing the right thing by focusing more on positive results. Such a publication might draw scientists to study the hypothesis who would not otherwise have done so.

On the other hand, it would be good if a scientist interested in testing a specific hypothesis could interrogate a database to find how many previous experiments had come up with positive and how many had come up with negative results.

Monday, October 21, 2013

Scientists don't believe everything they read


There is an interesting article in The Economist dealing with the validity of articles published in scientific and technological journals. I recommend that it be read completely. I quote one small portion (that assumes one in 20 incorrect hypotheses will be accepted):
(C)onsider 1,000 hypotheses being tested of which just 100 are true (see chart). Studies with a power of 0.8 will find 80 of them, missing 20 because of false negatives. Of the 900 hypotheses that are wrong, 5%—that is, 45 of them—will look right because of type I errors. Add the false positives to the 80 true positives and you have 125 positive results, fully a third of which are specious. If you dropped the statistical power from 0.8 to 0.4, which would seem realistic for many fields, you would still have 45 false positives but only 40 true positives. More than half your positive results would be wrong.

The article also states:
Fraud is very likely second to incompetence in generating erroneous results, though it is hard to tell for certain. Dr Fanelli has looked at 21 different surveys of academics (mostly in the biomedical sciences but also in civil engineering, chemistry and economics) carried out between 1987 and 2008. Only 2% of respondents admitted falsifying or fabricating data, but 28% of respondents claimed to know of colleagues who engaged in questionable research practices.
Lets think about that for a moment. Assume that every author knows 14 others well enough to know whether or not each had ever falsified results; in that case, if 2% of authors do in fact falsify, wouldn't something like 28% of respondents know someone who had falsified?

The quote says "know of" not "know". Cases of detected falsification become quite famous, so many scientists would "know of" a scientist in the same or a closely related field who had been revealed to have falsified date, even if that guilty scientist was not known personally.

And of course, it is likely that some of the people believed to have falsified data will not have done so.

In an article suggesting you not believe everything you read in a scientific journal, The Economist's writers and editors seem to have committed the same kind of inexactitude of which they warn.

Watch the video explaining the idea from The Economist.

Postscript: It occurs to me that in the example, before the experiment the probability of the hypothesis being true seems to be 0.10; after the experiment it seems to be 0.64. Thus the a posteriori probability is much higher given the positive outcome of the experiment. I would say that kind of change merits publication as that would encourage others to further study the hypothesis and add information that would help confirm or challenge it. That is the way science is supposed to be done.

Sunday, June 30, 2013

A suggestion for an improved method from selecting applicants for medical school.


I have recently done a series of posts on the use of Baysian approaches to improve peer review:
The same approach can be used in university admissions. I discussed the complexity of such decisions in a post yesterday.

One might consider the admission decision in U.S. medical schools to be based on undergraduate grade point average and completion of an undergraduate pre-med curriculum, grades on the Medical College Admission Test (MCAT), and ratings of the applicant by several interviewers. Typically the applicant pool at that point would be divided into three groups: the highly qualified who will be admitted without further discussion, the unqualified who will be rejected without further discussion, and a group of acceptably but not outstandingly qualified applicants. Further discussion would focus on this third group, choosing those who complement the first group to produce a well balanced class meeting as many of the objectives of the college as possible.

The previous posts have described a Baysian approach to pool the information from individual reviewers which has the side benefit of weighing the judgments of the reviewers who have the best correlations with each other more heavily than those who are less in agreement with their peers. The approach as described can be used to combine the information from the interviews of medical school applicants into a distribution of the probability that the applicant would be admitted.

The approach can easily be extended to utilize information from the undergraduate GPA and the MCAT.

Saturday, June 29, 2013

A thought about medical school admissions and the Bakke case.


I have been reading about The Regents of the University of California vs. Bakke. Bakke, a former Marine in his early 30s applied for medical school at UC Davis. The school admitted 100 students per class, setting aside 16 places for a special competition
to (1) reduce the historic deficit of traditionally disfavored minorities in medical schools and the medical profession, (2) counter the effects of societal discrimination, (3) increase the number of physicians who will practice in communities currently underserved, and (4) obtain the educational benefits that flow from an ethnically diverse student body.
Applicants for medical school are a pretty elite lot. Last year there were more than 600,000 applications but less than 20,000 matriculants in the schools. Thus there is an obvious problem that the schools face in selecting students to admit.

Clearly schools should not admit students who will not become physicians, dropping out for some reason or another. The schools maintain that they seek a composition of every class that will contribute to the quality of the education for all, and that makes sense to me since students have considerable influence on what their fellow students learn. Moreover, students from different backgrounds may help their classmates better understand and prepare for the diversity of patients that they will meet in practice. Unfortunately it is hard to predict the success students will have in a four year program, and I suspect harder still to predict the best combination of 100 students from hundreds of applicants. Test scores are unreliable and don't tend to predict into the distant future; there are known biases in that students from deprived backgrounds tend to do better when admitted than their ex ante test scores would indicate. Subjective judgement based on personal interviews is also unreliable.

Still the objective must be to select people who will graduate and become productive members of the medical community. Ideally the new entrants to the medical profession should match the needs of the patient population that are less served by the existing medical community. Note that the poor are more often sick, and often have less access to medical attention. Moreover, there is a general need for physicians in family practice to work in under served areas. Of course, there is a continuing need for physicians in other specialties, and for physicians everywhere. One of the issues that occurs to me is that patients often are better able to communicate with physicians with whom they do not face huge cultural or class differences. A physician that speaks the patient's native language is a plus.

Of course, medical students not only spend years in medical school, they spend more time interning, and most these days go on to specialize. Many find their vocation during this lengthly training, Thus it is hard to choose students who will not only be good physicians on completion of that training, but who will fill needs in the community.

Anyone who has worked with physicians will tell you that different specialties have different qualifications. Someone with limited vision might not be able to do some kinds of surgery, but might be fully capable of psychiatry; very few people are suited for the stress of pediatric oncology;  the personality that makes for good surgeons seems to differ from that found in most pediatricians or most pathologists. It is not only the case that medical schools must seek to provide basic medical education for people who will fill all these roles, but having people preparing for all these different specialties in the same class probably will help them as future practicing physicians to work effectively with physicians of other specialties.

In the case of the University of California, in which the state subsidized medical education, there was a legitimate interest to produce doctors who would stay in California and return services to the people of the state in return for the subsidy on their education. UC Davis is located in the California Central Valley, and would seem to have special responsibility to train professionals to work in that region and serve its population.

On the other hand, the University of California was established as a land grant institution with federal funding, and enjoys considerable federal funding in its operation. Thus the UC Davis Medical School also has an responsibility to fulfill national obligations.

I conclude that:
  • It would have been very difficult for UC Davis Medical School to articulate accurately and fully the criteria for selection students;
  • The actual selection process would necessarily only approximate the ideal, and would be based on heuristics rather than any algorithmic approach that would maximize fit of student body to school objectives.
  • Probably intensive review by medical educators is the best approach to the selection process.
The court
ruled unconstitutional the admission process of the Medical School at the University of California at Davis, which set aside 16 of the 100 seats for "Blacks," "Chicanos," "Asians," and "American Indians".
Most judges in their decisions found that race might be used as a criterion for admission under some circumstances, while others found that that question was not germane to the case.

The court also ordered that Allan Bakke be admitted to the school. Allan Bakke was clearly a superior student, who had served his country as a marine in Vietnam. He successfully completed medical school, graduating at age of 42 in 1982. He apparently became an Anesthesiologist, implying he went on to a residency and practiced in Minnesota. He apparently is now retired. I can only assume that the people of California would probably have gotten more medical service from their investment had they trained a different applicant than Dr. Bakke, one who was younger and more likely to practice in the state, especially one serving populations in need.

Perhaps courts should not substitute their judgement for that of medical faculties in making individual admission decisions.

Wednesday, May 15, 2013

Peer review in ex ante and ex post evaluation: probability based improvements in vote tallying.

In this 4th in a series, the use of probability analysis to improve the information content of ratings and rankings is extended to ex post evaluation of projects as well as ex ante review. The approach could be used in a variety of development projects. It might even be used in the context of village decision making.
I have recently added a series of posts on the use of probability theory, especially Bayes rule, and information theory to quantify peer reviewer information.
While the first posts focused on scientific peer review, the approach could be used in ex ante review of any set of alternative proposals. It could also be used in ex post review of completed projects, that is in their ex post evaluation. Let me suggest a very different application to illustrate the point.

A Village Level Example

Think about a village in a developing nation in which a number of development projects are possible. It is desired to develop community participation in the ex ante selection of projects to implement, and to obtain community evaluations of the success of the projects when completed. In such villages it is sometimes difficult to get people to give their real opinions in public, where they may be different than the opinions of village chiefs, those of their family members, or of a perceived majority. It might be that a hole-in-the-wall computer would allow community voting in a less threatening situation. (The computer could of course carry out many other functions while not being used for voting and improving the interpretation of the votes.)


A hole-in-the-wall computer might be installed in the village, including a card reader that could be used to identify the current user. For example a plastic card like a credit card might be given to each adult in the village identifying that person. Perhaps a touch screen could be used to allow people to vote on projects, and the projects could be identified by photos (as well as text) to allow illiterate adults to vote. (Note that readable ID cards would also be useful for other applications, such as for health information provision.)

A meeting could be held with the community to build interest in and support for community development through community projects. In the meeting, the participants could learn to use the computer to vote on projects. In the learning process they could record some judgments on hypothetical projects; doing so could be done in such a way as to increase enthusiasm for the project based approach to development. It would also provide a basis of data for the process described in the above references.

People might for example give one to five stars to each project, such as is done in Amazon.com reviews of books. The projects could be ranked according to the average number of stars given by community members.

Once the initial meeting was complete, a list of projects could be programmed into the computer and the village invited to vote within a given period. Initially, the selection of the first projects to implement might be simply by summing the number of stars given for each project, divided by the number of voters participating.

When projects were completed, the community could be invited to rate the success of each, using the same scale for the voting. Indeed, one might have a vote at the completion of the project on how well the project went, and a later vote on how much the community liked the service provided to it as a result of the project.

When enough data had been built up on the rating performance of the community members, the approaches described in the previous posts could be used to refine the interpretation of the voting.

Scale Up of the Idea

A rural development program might include hundreds of villages, each of which might use the technique to improve decision making and to track the quality of its projects.

Consider instead of a village, using the approach in a city. Commissions such as land use planning commissions could be provided with software using the statistical approach that I have described for selection of projects. It might even be useful in something like a grand jury context.

Similarly one might identify a thousand citizens of a community as a standing committee to evaluate local government performance. At any time, a number of projects and services might be listed on a website for the standing committee, and the members invited to enter their evaluations. At start up of the effort (or affiliation of a new member), a number of past projects might be evaluated to obtain required information on member evaluation performance. Then results might then be used by government officials in their management, or published to promote open government.

A donor agency might fund a program to strengthen intermediate cities, perhaps to provide an alternative to excessive growth of the largest city in a country to to provide for alternative poles of development. The approach could be used in each of the secondary cities.

Other Applications for Improvement of Review Performance

There would appear to be many other applications. Some possibilities are:
  • Finance: Donor agencies provide support to banking institutions, and the decisions on individual loans by banks would seem a likely application for probabilistic approaches to improve choice and evaluate choices made. This may be especially true in microfinance projects.
  • Technology innovation projects, in which large numbers of grants or loans are made to technological entrepreneurs, either to develop new technologies or to develop new small enterprises based on technological innovations.
  • Education projects that use peer review of teacher performance.
  • Health projects that use expert review of primary health worker performances. Peer review may also be introduced into hospitals where physician peer review is done of cases treated in the hospital.
Use your own imagination to construct other ways of voting on ex ante and ex post evaluation of alternatives using the probabilistic approach.


Saturday, May 11, 2013

From Estimating Probabilities of Ratings to Figures of Merit and Rankings


Two previous posts advocated a quantitative approach to peer review based on probability theory, Bayes rule and information theory. This post focuses on a figure of merit for ranking of submissions and a sequential process that seeks to maximize information where it is most needed deciding among submissions.
This is the third in a series of posts on quantitative approaches in reviewing scientific proposals and publications. The first two are:
A funding agency might have to select 150 proposals out of 1000 submitted  When I was involved in that kind of decision making, we seemed to find ourselves dividing the proposals into three groups on the basis of peer review:
  • Those so highly rated that they clearly were to be funded;
  • Those rated so low that they clearly were not to be funded;
  • A third group near the "cut off line" which might either be funded or not funded.
It doesn't much matter whether a proposal is ranked first or fifth in a set of 1000 if one is to fund 150; in either case it would be funded and the ranking is purely an internal aid to decision making. Nor does it matter much whether a proposal is ranked 700th or 800th as in either case it would not be funded. But it would matter a great deal whether it were ranked 150th or 151st. That difference might determine which of the two was funded and which was not, with a significant influence on the careers of the scientists involved.

Note however that the rating of proposals are subjective judgments. The rankings depend on estimates of what is likely to happen in the future if the research is funded. The judgment is made on the basis of a research proposal, and all research proposals are approximations. Moreover, reviewers are always less interested in the proposals that they are reviewing than in their own work, and are usually busy with other responsibilities. The uncertainty about the outcomes of the 150th and 151st proposals is almost certainly greater than the actual differences between those potential outcomes.

Still it is useful to have a defined procedure with quantitative indicators to formalize decision making. Such a procedure can be satisfying to both those managing the review process and those submitting proposals.
Consider the use of a figure of merit for proposals. I suppose that the standard approach would be to use the average of reviewer ratings for a proposal.

In the previously described procedure of sequential independent peer reviews, one might use the sum of the rating times its probability over all ratings for a given proposal. In the example, with ten possible ratings, they might be assigned values one through ten. The highest possible figure of merit then would be 10, were a proposal to have a 100% probability of the highest rating; the lowest possible figure of merit would be 1, were a proposal to have a 100% probability of the lowest rating. As described in the previous posts, such an indicator would incorporate more information on the reviewers and the correlations among ratings than would a simple average of ratings.

At any point in the review process, proposals could be rank ordered by their figure of merit.
  • Before the first reviews, all proposals would have the same figure of merit, since all would be characterized by the same a priori probability distribution of proposals over ratings.
  • After one review was received for each proposal, all proposals would have one of ten values of the figure of merit, since the first review could have only one of ten ratings. However, at that point the probabilities of the values of the ratings for the second review could be estimated. These would form something like a distribution around the actual rating received. The proposals could then (if desired) be shown on a graph. The X axis would be the rank order of the proposal; the Y axis would be the figure of merit and the possible figures of merit after the second round of reviews.
  • After the second round of reviews there would be more values of the figure of merit for proposals and narrower bands of potential values of the figure of merit. These too might be graphed.
  • Eventually the graph of the figure of merit versus rank order of the proposal would appear almost continuous.
At an early point in the process it would become apparent that no further reviews would be needed for some proposals. Those with very low estimated figures of merit could be eliminated from further reviewing since they clearly would not be funded; so too eventually some proposals would have figures of merit so high, and variance so low about their figures of merit that they would surely be funded. Evaluation effort could then focus more on the proposals still in doubt.

For example, while a couple of reviews might be required for all the proposals, perhaps a third review might be needed for only half of them, and further reviews for smaller and smaller portions of the field. Such a procedure would greatly reduce the demand on reviewers.

As a result the range of likely values of the figure of merit would be broader far from the competitive range (where relatively few reviews were used) and narrower in the competitive range (where there would be more reviews).

Thus, the effect would be to get more and more precision in the Figure of Merit for the proposals in the competitive range.

Note too, that in a final selection, one could look at the probability distributions of the ratings of the borderline proposals to be sure that there was a suitable high probability that the proposals being funded merited a higher rating than the proposals being rejected.

Subjective Probabilities, Ratings, Handicappers, and Open Access Online Scientific Literature


In a previous post I proposed an iterative process that can be used sequentially add information to the rating of research proposals, providing quantitative results. This post extends that method to show how information on the source of the proposal and the source of the review can be used to improve the results. It also provides a measure of the information provided by the review at each stage. The method is extended to rating open access online scientific publications and non-peer reviewers.

The Economist has published an article describing the rapid increase in open-access scientific publishing. The Internet potentially makes the distribution of scientific papers much less expensive than was the case in the past when they had to be printed on paper and sent via the mails. That expense of professional paper journals was becoming more and more burdensome on society as there were more and more scientists reading those papers and more and more papers by those scientists to be read.

The economic model in the past has been that professional societies sponsored journals, and their members paid dues to the societies which paid for the publishing and distribution of those journals. In other cases, scientific publishers published the journals, financing their publications via subscriptions to the journals.

Increasingly, the open-access costs are paid with the submission of papers or when they are accepted for publication. Governments and foundations that finance research are increasingly paying for the costs of the publication of results from the research that they finance.

In both cases, peer review was used to select the articles to be published in the journal. The peer review was used to select the superior submissions which would then be published. Major journals such as Science and Nature publish only one in ten papers submitted to them. Peer review by such prestigious journals was doubly effective in that scientists would not go to the effort of preparing and submitting papers to them unless they believed that the paper would have a decent chance of being published.

I quote from the article:
Outsell, a Californian consultancy, estimates that open-access journals generated $172m in 2012. That was just 2.8% of the total revenue journals brought their publishers (some $6 billion a year), but it was up by 34% from 2011 and is expected to reach $336m in 2015. The number of open-access papers is forecast to grow from 194,000 (out of a total of 1.7m publications) to 352,000 in the same period. 
Open-access publishers are also looking at new ways of doing business. Frontiers, for example, does not try to judge a paper's significance during peer review, only its accuracy—an approach also adopted by the Public Library of Science (PLoS), a non-commercial organisation based in San Francisco that was one of the pioneers of open-access publishing. It thus accepts 80-90% of submissions.
The New York Times recently published an article describing a problem that is emerging with the increase in open-access, online publishing. There is now a
parallel world of pseudo-academia, complete with prestigiously titled conferences and journals that sponsor them. Many of the journals and meetings have names that are nearly identical to those of established, well-known publications and events......... 
The number of these journals and conferences has exploded in recent years as scientific publishing has shifted from a traditional business model for professional societies and organizations built almost entirely on subscription revenues to open access, which relies on authors or their backers to pay for the publication of papers online, where anyone can read them......... 
But some researchers are now raising the alarm about what they see as the proliferation of online journals that will print seemingly anything for a fee. They warn that nonexperts doing online research will have trouble distinguishing credible research from junk. “Most people don’t know the journal universe,” Dr. Goodman said. “They will not know from a journal’s title if it is for real or not.”
The NYT article was informed by an earlier article in Nature, part of its series on the future of scientific publishing.

About Peer Review

I spent more than a decade managing peer review processes, and came to some conclusions about them. First, it is important to find real "peers", people who are not only experts, but whose expertise is truly applicable to the things that are asked to review. The peer reviewers must be carefully prepared with instructions as to the criteria for their evaluations. Ideally they should be experienced, so that they will have learned how to do peer review well. They must be motivated, in part by their understanding of the importance of their task; in person peer review where they must defend their judgments before other scientists also prove motivating. Care must also be taken to assure that no biases creep into the peer review.

IMDB entry for "10"
Still, in spite of care with all these aspects of the management of the peer review process, reviewers still come in with reviews of varying quality. In my experience, it was important to make judgments on the quality of reviewers, to give credence to reviews according to their perceived quality, and to not invite people back to review new things if they did not do well on previous reviews.

I recently posted on this blog presenting a method, based on experience in peer review, to quantify the subjective probabilities associated with peer review.

The Information Provided by Peer Review

The post suggested a ten point scale for evaluation. It could be applied however to a scale of any length. The method provided a probability, P(Ai), that the average peer reviewer (of the cadre used by the managers of the process) would assign rating Ai to a given submission. The method allowed the probabilities to be refined by a sequential process of inviting reviews one at a time.

The entropy of a probability distribution over a set of ratings is defined as the average uncertainty, as in the following equation:
The information provided by another review is the decrease in entropy. Thus, a sequential process could be monitored by the rate of change of information with additional reviews.

Reviewers Are Not All Equal

There are known biases in peer reviews. Some reviewers have a central bias, tending to concentrate ratings in the center of the scale; others do the opposite, tending toward ratings at the upper and lower extremes of the scales. Some reviewers are notably sour, tending to give low ratings in most reviews; others are generous, giving higher than average ratings.

I even found one reviewer who had a negative correlation with the other reviewers with whom he was associated!

If you have data it is possible to establish a set of estimated probabilities P(Ai / Aj) that the average high quality reviewer rating would be Ai if the specific reviewer gave a review Aj. Thus one can adjust the sequential review process described in the previous post to account for the individual tendencies of each specific reviewer. Contact me if you need more specifics (john.daly@gmail.com).

Entropy as a Measure of Reviewer Quality

Consider a table of rating frequencies. Each column corresponds to one of the ratings by the reviewer of interest. The cells in that column provide the count of ratings by other reviewers for those submissions that received the given rating by the target reviewer. An illustrative table is shown below:

From such a table one could calculate a probability table, which would allow an estimate of the Entropy associated with the probabilities.

Entropy is a measure of average uncertainty in a probabilistic process. An entropy can be calculated from a table such as the one above using the formula given above. It is a measure of the quality of ratings made by a target reviewer.

The entropy can be divided between the entropy of the distribution of the target reviewer's ratings and the average entropy of the probabilities of other raters given the target reviewer's ratings. (The proof of that statement is too long to be given here.)

If a target reviewer tends to give some ratings much more frequently than others, the information per rating is reduced.

In the table shown, the target reviewer ratings are highly predictive of those of the other reviewers. In such a case, the entropy is low. On the other hand, if there is wide variation between the target reviewers ratings and those of other reviewers, and the entropy is high, little information is gained from the target reviewer's ratings. Thus, the more the probability columns for ratings 1 through 10 look like the column on the right, the higher the entropy, and the less value in the target reviewer's ratings.

A further calculation might be useful, and that is the correlation between the ratings of the target reviewer and other reviewers, since it is even possible that a high rating by one reviewer might predict low ratings by other reviewers. One might identify a positive or negative correlation by eye. One might go further, for example calculate the probability of agreement between the target reviewer rating and other reviewer ratings, the probability of a difference of plus and of minus 1, of plus and minus 2, etc. That would provide a probability distribution.

Submiters Are Not All Equal

It is a poorly hidden secret that some scientists are more successful than average in having their proposals funded and their papers published. This of course is partly due to the fact that some scientists regularly propose better than average projects and write better than average papers.

Where reviewers can identify the person responsible for the submission that they are reviewing, they may rationally modify their estimates of the a priori probability that the submission is going to be good. A serious and expert reviewer will of course use the information obtained from a detailed reading and consideration of the submission, but will also use other information ooncerning the source of the submission.

What About non-Peer Review?


I think the Amazon.com process of having customers give ratings between one and five stars is prototypical of a process providing information to the online reader from people who may or may not be experts. Amazon.com uses a star rating system (example shown above). One presumes that the number of stars represents the quality of the offering as compared with other similar offering from Amazon.com. Some of the people providing ratings are experts. Thus in the case of a book of history, some will be professional historians whose research is closely related to the book they are rating. They may or may not be "peers" of the average reader. The 8 reviewers who gave one star (in the example above) to a book that had 264 five star and 136 four star ratings may have been right, but more probably they were not giving accurate ratings.

Amazon.com improves the rating system by asking people not only to give a rating but also to provide a review. It then asks customers to rate the reviews according to how useful they found them. Thus the reader can judge the quality of the star rating with added information on the review.

Handicappers, Horse Racing and Probability Estimates

It is known that the odds in pari mutual betting match closely the odds that the horses will actually win the race; if the betting odds are 3 to 1 for the favorite, the favorite will win about a quarter of the time. How can that be?

Part of the answer is that horse racing fans are rather good at estimating the probability that horses will win races. The study the horses, the breeding, the training, and past performance and make their judgments. Their subjective judgments on probabilities are not uninformed.

Moreover, there are professional handicappers who are paid for making the odds on horse races, and those odds are published. They are available in newspapers or in tip sheets sold at the race track. Punters take the handicapper predictions into account in making their own judgments.

In betting the actual pari mutual odds are based on the amounts bet, not the number of betters. The casual race course visitor may make a $2 bet on his inexpert judgment. The informed professional gambler will make much larger bets when the odds seem right. Thus the amount of the bet carries implicit information on the credibility of the punter's estimates of probability. The larger bets of course have more influence on the final pari mutual odds.

So What?

The procedures described above can not only provide quantitative estimates of the quality of scientific papers (or books or movies), but can be used to improve those estimates sequentially as more and more reviews are received. They can also provide quantitative estimates of the amount of information in the current rating. They can be modified to include information on the track record of the author of the submissions and on the past performance of the reviewers.

It would seem to be important to find such means to help scientists choose which papers to read in the burgeoning corpus of open-access online scientific papers. They may even find use by online vendors such as Amazon.com and eBay.com.

Tuesday, May 07, 2013

Probability Analysis to Improve Scientific Peer Review


Use of a proposed Bayesian approach to the information from a sequential peer review process may improve the quality of decisions and reduce the effort required of peer reviewers. The process can be carried out with a limited amount of data relatively easily obtained from an existing panel review process.
I have a suggestion for an alternative way to do peer review. It is applicable to organizations such as the National Science Foundation and the National Institutes of Health that regularly review large numbers of proposals with a significant number of reviewers per proposal.

As a preliminary for this method, the organization would ask that reviewers in addition to their normal review tasks provide a rating for each research proposal. The rating would  be the subjective probability that the proposal would merit funding when the research was completed. Since these would be subjective probabilities, the reviewer might simply specify whether that probability is between 0.0 and 0.1, 0.1 and 0.2, 0.2 and 0.3........ 0.9 and 1.0. The results of this exercise would be a table such as the following:

Table 1

Each column would correspond to the range of subjective probabilities that a proposal would be judged to be probably worth funding. A specific proposal would be assigned to the column if the average of reviewer probabilities fell in the specific range (taking each at the mid point of the assigned range of values).  Each row corresponds to the proposals given the rating shown in the left hand column. This of the 68 ratings of 0.0 to 0.1 given to proposals by reviewers, 51 would have corresponded to a proposal with average value between 0.0 to 0.1, 11 to a proposal with average value between 0.1 and 0.2, 5 to a proposal with average value between 0.2 and 0.3, and one to a proposal with average value between 0.3 and 0.4. None of the proposals with a single review in the lowest range would fall into a column further to the right.

From this table a second table would be derived such as the following:

Table 2

The bottom row, labeled P(A), each entry is the probability of a proposal falling in the specified  range of subjective probabilities, as estimated from the sample of proposals reviewed. The probability is estimated by dividing the total at the bottom of the corresponding column in Table 1 by the total at the bottom of the right hand column of Table I.

Given that the survival of research laboratories is based on writing proposals for worthwhile research projects, it would seem likely that there would be higher probabilities of good proposals. I have shown such values in the sample tables (which are manufactured and not based on real data).

Similarly, the right hand column of Table 2, labeled P(B), is the probability of a reviewer assigning the specified probability to a randomly selected proposal. It is calculated from the top table by dividing the corresponding entry in the right hand column of Table 1 by the overall total at the bottom of the right hand column of Table 1.

Finally, the individual boxes in the table, which might be labeled P(B/A) are the estimated probabilities that the average probability of the reviews will correspond to that in the column given that the rating by the reviewer is that in the row given.

Now consider Bayes Theorem:


Consider then a process by which a new proposal is received. It is assigned to a single reviewer, who assigns it to a probability range. The a priori probabilities of a random proposal falling in the specified categories are given by the bottom row of Table 2. Thus there are 10 a priori probabilities for the 10 different values of A1, A2,......, A10.

The a posteriori probability of each category is given by the equation above, using the value of P(B) and P(B/A) from Table 2.

Since the reviewers can be assumed to be independent, a second reviewers rating can be used to produce a new a posteriori set of values from the first by the same procedure.

So What? A Screening Procedure

One could have a single reviewer evaluate a single proposal, giving his/her rating in terms of the subjective probability that the project would be worthwhile. With a transition probability table such as that shown in Table 2, one could then use Bayes Theorem to calculate the a posteriori probability of each rating.

For example, if the first proposal review were a rating of 0.9 to 1.0, using the data in Table 2 one would calculate that the a posteriori probabilities were:
  • range 0.9 to 1.0: 83%
  • range 0.8 to 0.9: 13%
  • range 0.7 to 0.8: 3%
  • range 0.6 to 0.7: 0.5%
  • zero for all the other ranges.
That single review might be sufficient to accept the proposal. Say that an added review of the proposal were added. The probabilities of the new rating could be calculated from the a posteriori probabilities given above and the data in Table 2. Thus, in the example, the probabilities of the second rating given the first was 0.9 to 1.0 would be:
  • probability of rating 0.9 to 1.0: 63%
  • probability of rating 0.8 to 0.9: 23%
  • probability of rating 0.7 to 0.8: 11%
  • probability of rating 0.6 to 0.7: 2.5%
  • probability of other ratings would be zero or negligibly small.
Thus a relatively small number of reviews would probably be sufficient to determine whether the proposal should be accepted or not.

Once data had been gathered to create the table of conditional probabilities such as that shown in Table 2 it would be a relatively straight forward job to create software to update the marginal probabilities P(A) and P(B) for every proposal. All that would be needed for the user of the software would be to input each new rating to see the updated probabilities.

Refinements

At one point I looked at the correlation between ratings by reviewers and discovered that some individuals were more correlated with the average review than others. Indeed, I found one reviewer whose ratings were negatively correlated with the consensus of other reviewers. This, collecting data of the kind suggested might help to judge whether individuals should be invited to continue providing reviews.

It is also likely that there will be consistent biases in the reviews of individual reviewers. Some reviewers, for example, have been relatively unwilling to give either very high or very low ratings to proposals, preferring to give middle range reviews. Others are more willing to call a proposal either very good or very poor. Given such knowledge, the ratings given by reviewers might be adjusted to be more comparable to a standard distribution.

Tuesday, October 02, 2012

How good is the information provided on pharmaceuticals?


In its review of Bad Pharma by Ben Goldacre, The Economist criticizes the information published on pharmaceuticals produced by the pharmaceutical industry.

Dr Goldacre describes the routine corruption of what is supposed to be an objective scientific process designed to assess whether new drugs work, whether they are better than drugs already on the market and whether their side effects are a price worth paying for any benefits they might convey. The result is that doctors, and the patients they treat, are hobbled by needless ignorance. 
So, for instance, pharmaceutical companies bury clinical trials which show bad results for a drug and publish only those that show a benefit. The trials are often run on small numbers of unrepresentative patients, and the statistical analyses are massaged to give as rosy a picture as possible. Entire clinical trials are run not as trials at all, but as under-the-counter advertising campaigns designed to persuade doctors to prescribe a company’s drug.
I have never personally observed an FDA drug review, but I know that it is a peer review process, and I have observed many medical research peer review meetings in the United States and have worked with people from FDA. I would be very surprised if the FDA licensing process for new drugs is as flawed as Dr. Goldacre seems to suggest. Since he is British, perhaps his criticism applies to drug approval processes in other countries -- I wouldn't know nor be able to comment on those processes.

On the other hand, with the application of the computerized patient record systems that are coming into operation across the United States, it should be possible to provide much better information on patient response to pharmaceuticals, including both efficacy and adverse reactions. With increasing availability and use of genetic information, it should be possible to provide much more detailed information on which drugs are likely to prove effective against which conditions in which patients.

The article also states:
Many published studies are not written by the academics whose names they bear, but by commercial ghostwriters paid by drug firms.
I don't know how pharmaceutical companies use technical writers in helping researchers get their results into print, but I have worked with technical writers when I was a research engineer and when I was running research grants programs. In both cases they were really helpful in getting what I wanted to say into better shape to be understood by the reader, and did so without ever trying to compromise the accuracy of what I was writing. Indeed, They always deferred to my understanding of the substance of the articles. I also subjected some of the articles I wrote seeking to popularize our scientific results to an association of professional science writers, and benefited from their insightful critiques of the articles.

I suspect that the average professional carrying out drug tests can write pretty well -- you don't get that kind of job without having succeeded through a number of levels of education (although technical writers have told me that some of the stuff that they have to edit is pretty bad). Even a good writer can benefit from an outside view of their prose provided by a good professional. That is why publishers provide fiction writers with editors.

On the other hand, I am not sure how good the communication is to doctors and I am pretty sure it is not too good to patients. The problems may not be in the quality of the information provided, but in the quality of its reception. Of course, the instructions provided with prescription meds is almost unreadable, perhaps because it is written to satisfy bureaucratic regulations and legal advice on how to limit product liability, and not to maximize understanding by the patient.

Monday, September 17, 2012

Some tests are better at determining quality of the performer.


There is no doubt in a golf match whether or not the ball falls into the cup. In tournament play, scores are very carefully kept. Courses are carefully designed to present individual challenges while maintaining considerable inter-course similarity; they define par for each hole, so that scores for 18 or 72 holes with respect to par are relatively similar from course to course. Courses do play differently on different days.

The idea is that the outcome of a tournament is primarily determined by the play of the golfer. Players obviously differ one from another in their ability. The score on a specific day is also affected by the how well the golfer is playing that day and what might be termed luck -- how a ball bounces or the specific place in which it lands. These seem to be relatively random. The first day of a tournament often sees relatively low ranked players in the top ten, but after four days and 72 holes the leaders are usually among the highest ranking players on the tour. Indeed, over thousands of holes played during a year, the best players seem to come out on top of the rankings.

One way of looking at a player's performance is the Z score -- the distance between the score of that golfer and the average of those playing in the same tournament, measured in standard deviations. I draw on a recent article by Bill Barnwell for the following.) Tiger Woods, in perhaps the best performance by a golfer in a century, produced a 15-stroke win at the U.S. Open in 2000, which had a Z-Score of -4.12. That is, he was more than four standard deviations better than the average of the the world's best golfers who had played the full 72 holes of one of the four most important pro-golf tournaments of the year. His average Z-Score over the many tournaments he played that year was -2.14. Thus he was consistently scoring two standard deviations better then the professional golfers "making the cut", something that would have a vanishingly small probability of occurring were he but an average professional. In the U.S. Open, however, his score was a further two standard deviations about the average for his competitors, suggesting that he was playing at the top of his form and the luck was with him that day.

I would suggest that scoring on a standardized multiple choice test, such as some of those produced by the Educational Testing Service would be similar at some level to that of golf. There would be very little uncertainty about any answer for any test taker. While the ETS works to see that the tests are standardized, there would be some variation in the scores of a student taking a test several times due to changes in the specific questions to which she responded. The more important sources of variation would be how well the student took the test on the specific day, and how good the student was generally on taking such tests.

Contrast this with an essay test. Not only is variation introduced by the student, but also by the person grading the essays. One could for example, run a set of essays by a panel of reviewers and estimate the distribution of grades.

I got thinking about this while watching Broadway or Bust, a contest in which 60 high school students compete in a singing, dancing, acting competition testing their potential for the Broadway musical theater. The students, who have different talents and different levels of training, must perform combining acting, dancing and singing skills (and few if any are expert at all three). They perform different numbers emphasizing different skills. They are judged on the basis of their performances by a panel of Broadway professionals, who themselves have different backgrounds and abilities.

In some sense the competition is fair, in that the successful students will be those who most impress that set of judges with that specific performance. The successful student will probably be at the top of his/her form, with a number that reaches those judges, who happen to like that performance. It seems unlikely that the student who will have the best career on Broadway will be recognized in this competition, but we will need a lifetime to be sure. Lets hope the students realize that they are all winners.


Wednesday, June 20, 2012

A thought about college admissions


The July-August issue of The Atlantic contains the 2012 "Ideas Report". One of the ideas, proposed by Barry Schwartz, is to admit students to college by lottery. The idea would be to identify all of the qualified people from the complete list of applicants, and then randomly choose from among the qualified as many as the college could accept.

I rather like the idea. As Schwartz points out, it would have the advantage that the process would not tell qualified candidates that they were not good enough for the college.

I have done a lot of selection from large lists of applications. Indeed, I once did a computer program to rank order college applicants in order to admit the highest ranking ones. I have come to the conclusion that we are seldom good enough at recognizing quality that our rankings can be assumed accurate. Assume that you get 1000 applications and will be able to accept only the 100 best. Think how unlikely any ranking procedure would be to accurately discriminate among the applications grouped around the decision point. What is the probability that the application ranked 101st is actually better than that ranked 100th? I would suppose it is pretty high.

The suggestion however opens a world of possibilities. Selecting randomly does not mean that the acceptances would be drawn with equal probability from the qualified. Lets think about 150 applicants out of the 1000 judged as qualified. It would be a pretty weak ranking system if the first ranked application was not significantly better than that ranked 150th. So maybe there should be a higher probability of admitting the first ranked than the 150th ranked applicant. One could, for example assign a probability of one that the first ranked candidate would be selected and a probability of zero that the 151st ranked applicant would be picked, decreasing the probability linearly over the range. This would be very easy to implement on a computer.

Alternatively, you could choose those ranked 1 to 110 with probability one, and then those from 111 to 120 with probability one-half. Indeed, there are many, many ways that you could choose 100 candidates from a ranked list of 150 qualified candidates.

In reality, there are a lot of things a college might want in an entering class in addition to qualified students. For example, it might not want a class with 90 women and 10 men, or it might choose to have a class with some diversity in life experiences. It might want to be sure that there was a variety of academic interests, so that it did not have a class composed entirely of drama students or math students.

The Schwartz suggestion opens the field for some good thinking about how best to select an entering class from a large number of applicants.